-
 Would you like to get an overview of the fundamentals of Agile? This session will dispel the misconceptions of Agile and provide an understanding and definition of terms such as “bi-modal”, “Scrum”, “Kanban”, “weighted shortest job first” and “SAFe”. We will also talk about how Clarity fits into the Agile discussion and provide thoughts and practices on how PMOs are responding to this trending methodology.
 -
 Agile metrics can be very different from traditional waterfall metrics. This session will walk through some of the key Agile metrics describing how and why they are used. Effective methods in reporting and sharing will also be covered.
 -
 Learn about the various techniques and emerging methods companies are taking to capitalize Agile work. You'll learn how some companies are moving away from timesheets and using models based on story points and team rates to generate capitalization reporting.
 -
 Are you struggling with implementing Agile tools in your organization in addition to Clarity? This class will review best practices for implementing agile tools in conjunction with Clarity - living in a Bi-Modal world. We will discuss how Clarity can be used to govern both types of work and teams and how Agile tools should interface into Clarity.
 -
 Struggling to use an external scheduler like MS Project or Smartsheet with Clarity or investigating its potential? Learn how to effectively use these tools with Clarity in this training, which includes best practices and lessons learned. We will show both OOTB and Rego build connectors that will make the bidirectional connections seamless.
 -
 Are your project teams using SharePoint effectively and getting the most value out of it? Is document management a daily struggle? Learn how to use SharePoint with Clarity in a more seamless way to improve collaboration and team productivity.
 -
 A review of how Northern Trust integrates financial systems with Clarity PPM bilaterally, providing the Finance organization crucial information, and NT Project Managers with a birds-eye view of project financials. Utilizing the Rego Data Extractor and the Rego Data Processor, these information exchanges help Portfolio and Project Managers eliminate their manual and redundant efforts, solidify their overall data accuracy, and dramatically improve the content provided to their Execs for decision-making.
 -
 By its very nature, the shift to Product Funding is going to require that tracking of that funding. Agile tools do not have much, if any, financial capabilities, so it is important to create an eco-system that can support this value stream—from funding, through delivery, and finally to tracking the realization of financial value. Learn how Rally and Clarity PPM do this very well together.
 -
 Are you starting a project/financial management implementation, or do you want to compare how you are using these functions vs. others or best practices? In this class we will discuss some best practices from successful customers.
 -
 Do you want to understand the OOTB configuration and functionality of project management? In this class, we will review the OOTB objects, views, and functions of projects, financial plans, tasks/assignments, IRC, and other related areas. We will cover both classic and new UX highlighting differences.
 -
 Broadcom’s Laureen Knudsen and Noël Rodriguez discuss the current and evolving state of the PMO.
 -
 Agile is here to stay, but waterfall may be as well. Companies around the world struggle with living in a bimodal development world, while trying to go through an agile transformation. This session will discuss best practices and lessons learned within companies that have gone through agile transformations. We will also review SAFe as a potential approach.
 -
 Have you looked in the regoXchange or reviewed Rego’s innovation offerings? This class will show you the power of Rego’s pre-built content library, integrations, and other assets. See example after example of portlets, processes, and materials you can use to add value to your instance of Clarity. Learn how you can introduce email-based approvals with Rego's action item responder. Get a peek at Rego's new MSP integration that avoids the issues faced with the OOTB integration. Finally, understand Rego's pre-built connectors and how they can benefit your instance. Including blueprint migrator. Include free tools like GEL builder, query, XOGbridge.
 -
 No matter how hard we try, many organizations cannot pry Excel out of the hands of project and resource managers. In this class we will explore possibilities that give up the battle and embrace Excel as a great data entry tool. We will show some neat case studies on quick Excel integrations deployed at customers.
 -
 You are no longer regulated to the desktop browser to respond to action items. Learn how Rego solved this problem using just your email. We’ll talk about various use cases where you would get maximum benefit from a simple response on an action item directly from your email. It doesn’t matter if you are using email on your desktop, laptop, phone or tablet. The Action Item Responder as you covered.
 -
 This portlet displays the % allocation of resources to projects. The portlet shows if the resource is allocated to the projects as an individual resource or as part of an Agile team, in which case it will display the resource % allocation to the team and what that will represent in terms of % allocation to the project. The Total Allocation % display the allocation of the resource to all investments is allocated to. Remaining Capacity and Over/Under columns will help identify the resources that still have availability and the ones that are over allocated.
 -
This portlet displays the % allocation of resources to projects. The portlet shows if the resource is allocated to the projects as an individual resource or as part of an Agile team, in which case it will display the resource % allocation to the team and what that will represent in terms of % allocation to the project. The Total Allocation % display the allocation of the resource to all investments is allocated to. Remaining Capacity and Over/Under columns will help identify the resources that still have availability and the ones that are over allocated.
-
 The Timesheet Notes portlet displays all timesheet notes split out by resource, investment and task. This is very useful in situations where you want to review multiple notes as you do not have to open each note separately. The table below describes the available filter fields in the portlet.
Column Label Description Timesheet Period Start Range of time periods to display filtered by start date Timesheet Period Finish Range of time periods to display filtered by finish date Resource Resource(s) to display Type Note on a timesheet or time entry (task specific) -
The Timesheet Notes portlet displays all timesheet notes split out by resource, investment and task. This is very useful in situations where you want to review multiple notes as you do not have to open each note separately. The table below describes the available filter fields in the portlet.
Column Label Description Timesheet Period Start Range of time periods to display filtered by start date Timesheet Period Finish Range of time periods to display filtered by finish date Resource Resource(s) to display Type Note on a timesheet or time entry (task specific) -

This portlet displays the monthly allocation per resource. The PM can view by the RM or the resource to get the data for monthly resource allocations. The table below describes the available filter fields in the portlet. Column Label Description Work Effort Manager Manager of the Investment the Work Effort is on Work Effort Active Active status of the Investment the Work Effort is on Resource Resource’s Name Internal Resource ID Resource’s ID Zero Allocation Show Allocations that equal zero Open for Time Entry Is the Resource Open for Time Entry Resource Active Resource’s Active status Role Resource’s Primary Role OBS Unit Resource’s OBS Start Allocation Start Time to filter by End Allocation Finish time to filter by -
This portlet displays the monthly allocation per resource. The PM can view by the RM or the resource to get the data for monthly resource allocations. The table below describes the available filter fields in the portlet. Column Label Description Work Effort Manager Manager of the Investment the Work Effort is on Work Effort Active Active status of the Investment the Work Effort is on Resource Resource’s Name Internal Resource ID Resource’s ID Zero Allocation Show Allocations that equal zero Open for Time Entry Is the Resource Open for Time Entry Resource Active Resource’s Active status Role Resource’s Primary Role OBS Unit Resource’s OBS Start Allocation Start Time to filter by End Allocation Finish time to filter by -
This portlet displays the monthly allocation per resource. The PM can view by the RM or the resource to get the data for monthly resource allocations. The table below describes the available filter fields in the portlet. Column Label Description Work Effort Manager Manager of the Investment the Work Effort is on Work Effort Active Active status of the Investment the Work Effort is on Resource Resource’s Name Internal Resource ID Resource’s ID Zero Allocation Show Allocations that equal zero Open for Time Entry Is the Resource Open for Time Entry Resource Active Resource’s Active status Role Resource’s Primary Role OBS Unit Resource’s OBS Start Allocation Start Time to filter by End Allocation Finish time to filter by -
 This is a graphic portlet that pulls the average schedule variance by OBS node of the project. The portlet allows you to choose any OBS that is associated to the Project Object. Users can filter by:
- OBS Type
- If the project is financially approved?
- Financial Status
-
This is a graphic portlet that pulls the average schedule variance by OBS node of the project. The portlet allows you to choose any OBS that is associated to the Project Object. Users can filter by:
- OBS Type
- If the project is financially approved?
- Financial Status
-
This is a graphic portlet that pulls the average schedule variance by OBS node of the project. The portlet allows you to choose any OBS that is associated to the Project Object. Users can filter by:
- OBS Type
- If the project is financially approved?
- Financial Status
-
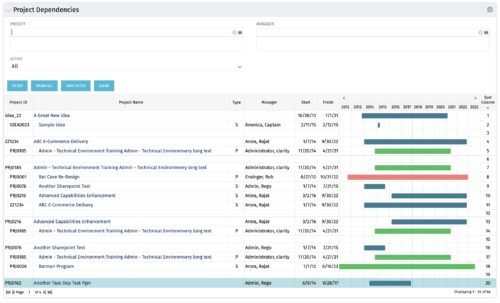
The Project Dependencies portlet displays all projects and their associated dependencies that the logged in user has rights to. This can assist in scheduling and visualizing the breakout of dependencies. The table below describes the available columns in the portlet. Column Label Description Project ID ID of the project Project Name Name of the project Type Relationship to above project, Parent Project (P) or Sub Project (S) Manager Manager of the project Start Start Date of the project Finish Finish Date of the project Gantt Visualization of project timelines Sort Column Used to order the columns for proper display of the portlet dimkey Internal code used by the query Inv_hlth_int Internal code used by the query Link_dbid Internal code used by the query link_toggle Internal code used by the query rel_active Internal code used by the query rel_dbid Internal code used by the query rel_mgr_dbid Internal code used by the query rel_sort Internal code used by the query -
The Project Dependencies portlet displays all projects and their associated dependencies that the logged in user has rights to. This can assist in scheduling and visualizing the breakout of dependencies. The table below describes the available columns in the portlet. Column Label Description Project ID ID of the project Project Name Name of the project Type Relationship to above project, Parent Project (P) or Sub Project (S) Manager Manager of the project Start Start Date of the project Finish Finish Date of the project Gantt Visualization of project timelines Sort Column Used to order the columns for proper display of the portlet dimkey Internal code used by the query Inv_hlth_int Internal code used by the query Link_dbid Internal code used by the query link_toggle Internal code used by the query rel_active Internal code used by the query rel_dbid Internal code used by the query rel_mgr_dbid Internal code used by the query rel_sort Internal code used by the query -
The Project Dependencies portlet displays all projects and their associated dependencies that the logged in user has rights to. This can assist in scheduling and visualizing the breakout of dependencies. The table below describes the available columns in the portlet. Column Label Description Project ID ID of the project Project Name Name of the project Type Relationship to above project, Parent Project (P) or Sub Project (S) Manager Manager of the project Start Start Date of the project Finish Finish Date of the project Gantt Visualization of project timelines Sort Column Used to order the columns for proper display of the portlet dimkey Internal code used by the query Inv_hlth_int Internal code used by the query Link_dbid Internal code used by the query link_toggle Internal code used by the query rel_active Internal code used by the query rel_dbid Internal code used by the query rel_mgr_dbid Internal code used by the query rel_sort Internal code used by the query -
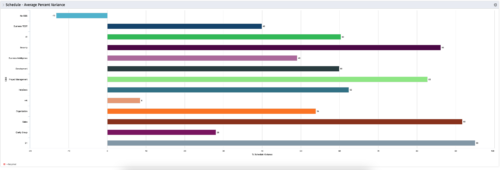
 Bar Chart displays average percent variance for all active projects by OBS unit. Percent variance = Planned Cost - Budgeted Cost / Budgeted Cost * 100. Projects with no Budgeted Cost are ignored for the calculation. Then all project variance percentages are algebraically added (some may be negative), and divided by total projects with a variance. This yields the Average Percent Variance. This calculation is performed for active projects in each OBS unit. OBS units include all units at all levels where projects are attached. Portlet filterable by OBS, Financial Status, and Financially Approved. Vertical axis = OBS Unit Name. Horizontal axis = Variance Percent. Data value = Average Percent Variance. Mouseover value = OBS Name + Average Variance Percent.
 -
Bar Chart displays average percent variance for all active projects by OBS unit. Percent variance = Planned Cost - Budgeted Cost / Budgeted Cost * 100. Projects with no Budgeted Cost are ignored for the calculation. Then all project variance percentages are algebraically added (some may be negative), and divided by total projects with a variance. This yields the Average Percent Variance. This calculation is performed for active projects in each OBS unit. OBS units include all units at all levels where projects are attached. Portlet filterable by OBS, Financial Status, and Financially Approved. Vertical axis = OBS Unit Name. Horizontal axis = Variance Percent. Data value = Average Percent Variance. Mouseover value = OBS Name + Average Variance Percent.
-
 Pie Chart Portlet displays counts of active projects with various Stale ratings. Calculation is Percent Stale Tasks = number of open (not completed) tasks with a finish date over 15 days old, divided by total open tasks. Filterable by OBS structure and project manager. Data label = project count. Mouse-over and Legend labels = stale rating. More than 90% Stale means 90 to 100% of open tasks on a project have finish dates older than 15 days. More than 71% Stale means 71 to 89% of open tasks on a project have finish dates older than 15 days. 0 - 70% Stale means fewer than 70% of open tasks on a project have finish dates older than 15 days.
 -
Pie Chart Portlet displays counts of active projects with various Stale ratings. Calculation is Percent Stale Tasks = number of open (not completed) tasks with a finish date over 15 days old, divided by total open tasks. Filterable by OBS structure and project manager. Data label = project count. Mouse-over and Legend labels = stale rating. More than 90% Stale means 90 to 100% of open tasks on a project have finish dates older than 15 days. More than 71% Stale means 71 to 89% of open tasks on a project have finish dates older than 15 days. 0 - 70% Stale means fewer than 70% of open tasks on a project have finish dates older than 15 days.
-
Pie Chart Portlet displays counts of active projects with various Stale ratings. Calculation is Percent Stale Tasks = number of open (not completed) tasks with a finish date over 15 days old, divided by total open tasks. Filterable by OBS structure and project manager. Data label = project count. Mouse-over and Legend labels = stale rating. More than 90% Stale means 90 to 100% of open tasks on a project have finish dates older than 15 days. More than 71% Stale means 71 to 89% of open tasks on a project have finish dates older than 15 days. 0 - 70% Stale means fewer than 70% of open tasks on a project have finish dates older than 15 days.


Copyright 2023 • Rego Consulting Corporation • Privacy Policy