-
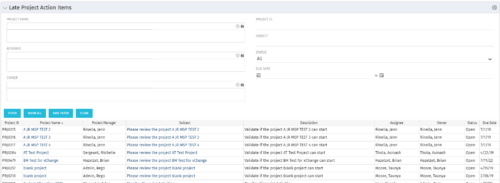 The Late Project Action Items portlet displays all action items related to active projects that the logged in user has view rights to. The action items displayed are those that are past their due date with a status of “In Progress” or “Open”. The portlet provides a Project Manager the ability to view and track action items across multiple projects without going into each project individually. In a single consolidated list, all late project action items can be easily viewed, along with the project with which they are associated, the individual assigned, and the owner of the action item.
 -
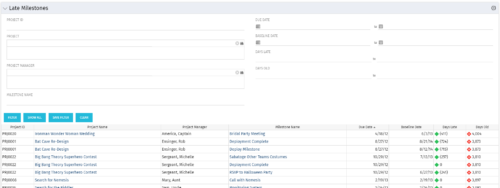 The Late Milestones portlet displays all action items related to active projects that the logged in user has view rights to. The milestones displayed are those that are not closed but are past their finish date or past their baseline finish date. The portlet provides a Project Manager the ability to view and track action items across multiple projects without going into each project individually. This portlet provides a single consolidated view of late milestones based on the current project baseline, and the age of the milestone. The portlet will display the Project ID, Project Name, Project Manager, Milestone Name, Due Date, Baseline Date, Days Late (calculated from baseline dates), and Days Old (calculated from today’s date).
 -
 The Executive Dashboard portlet displays information regarding projects the user has security rights to view. It provides a one-stop place for the PMO or management to view all critical information about projects. The portlet not only displays status indicators as well as dates for late items, variances and days late, but also displays the project status fields from the Status Report sub-object.
 -
 The Resource Data Issues portlet is used to identify data exceptions related to resource setup. This portlet helps to identify where resources are missing key data or are possibly sitting in an exception state. This view will show resources that have one or many exceptions, including inactive resources. There is no security built into this portlet - all resources will show. The only required field in the filter is Days, which is the number of days since the user last logged in. The user may also narrow the results by resource, OBS, or project type.
 -
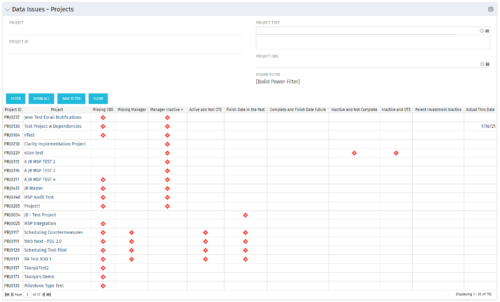 The Project Data Issues portlet is used to identify data exceptions related to project setup. This portlet helps to identify where projects are missing key data or are possibly sitting in an exception state. This view will show projects that have one or many exceptions, including inactive projects. The user may also narrow the results by project, OBS, or project type.
 -
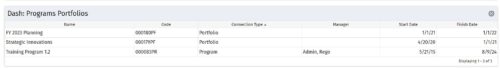 The Dashboard: Programs Portfolios portlet is placed on the dashboard page of a project. This portlet will show any programs or portfolios the project is a subproject of. The portlet will display the name, code, connection type, manager, and start/finish dates.
 -
 The Capacity Graph - Investment portlet displays Availability, Allocations, Assignments and Actuals for active resources in a single project. This portlet pulls from timeslices and allows the user to filter on weekly, monthly, or quarterly data. This portlet provides a Project Manager with a simple way to analyse: Allocations vs. Actuals and Allocations vs. ETC. Depending on metric goals, the graph allows the user to determine where areas of improvement may exist.
 -

 The Capacity Graph portlet displays Availability, Allocations, Actuals and Assignments for one or more active resource(s) in a single view. This portlet pulls data from timeslices, and allows the user to filter on a weekly, monthly or quarterly data. The Estimated Time to Complete (ETC) and Allocation data will only show for projects that are active. This portlet provides Resource Managers, PMOs and Executives with a simple way to analyse: Allocations vs. Availability, Allocations vs. Actuals, Allocations vs. ETC and ETC vs. Availability. The graph allows the user to determine where areas of improvement may exist and quickly identify potential areas of constraint. Note: the information displayed is dependent on what the user has security rights to view.
 -
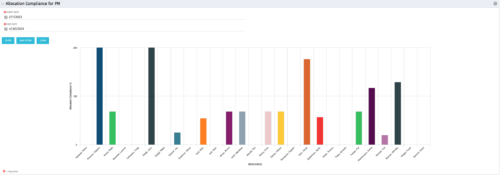 The Allocation Compliance by Person (Project Manager) portlet gives a view of resource allocation compliance for active resources on the team of an investment the logged in user is the manager for. It allows the PM to see resources on their project over the coming months and whether they are over or under allocated. This portlet leverages the daily allocation and daily availability slices as well as only active investments. The portlet provides filters for specific dates, filtering by resource ID, and resource name may also be added.
 -
 The All Assignments portlet displays resource assignments across multiple projects. Currently, assignment information displayed for the project, in OWB, or MSP is limited to a single project. This portlet will provide a single view of the assigned data for all assignments across multiple projects. The portlet displays project actuals and estimates from the project (datamart tables). The Days Late field is calculated by the baseline date, while the Days Old field is calculated by today's date. Note: Only the projects that the user has viewer rights to will show up in the list. Filters provide the PM, RM, and individual resource the ability to monitor work progress across multiple projects. For example: ~ PMs can filter for all assignments that were to be completed by a given date but still have "Started" or "Not Started" status. ~ If multiple projects are utilizing the same resource, the PM or RM can filter for assignments utilizing that specific resource to prevent over-utilization. ~ A resource may filter for all assignments assigned to them, providing a picture of their total body of work.
 -
 The Investment Issue Register report displays comprehensive information for each investment issue. The report only includes investments where the Risk, Issues, and Change modules are available. Report Prerequisites Verify that you have completed the following prerequisites before you run this report: • The investment must have at least one issue for the project to display in the report. • The issue properties must have fields such as description, category, resolution, target resolution, impact date, and originating ID completed for them to display data in the report. The issue name, issue ID, priority, status, and owner are required in Classic PPM so they always display data. • The Load Data Warehouse job must be run before you run this report. If the Data Warehouse is not populated, the report will not display any data. Also, most of the report parameters do not display options.
 -
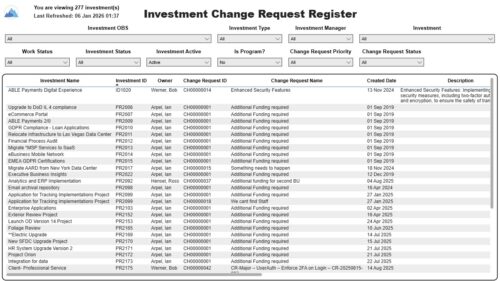 The Investment Change Request Register report displays comprehensive information for each investment change request. The report only includes investments where the Risk, Issues and Change modules are available. Report Prerequisites Verify that you have completed the following prerequisites before you run this report: • The investment must have at least one change request for the project to display in the report. • The change request properties must have fields such as description, change in cost, change in schedule, change in resources, category, expected close, approved by, approved date, and originating ID completed for them to display data in the report. The change request name, change request ID, priority, status, and owner are required in Classic PPM so they always display data. • The Load Data Warehouse job must be run before you run this report. If the Data Warehouse is not populated, the report will not display any data. Also, most of the report parameters do not display options.
 -
 The need for a dual operating model drives the need for a deliberate tooling architecture that will usually include a PPM / SPM and an Agile tool. Are you struggling with implementing Agile tools in your organization in addition to Clarity? This class will review best practices for implementing Agile tools in conjunction with Clarity - living in a Bi-Modal world. We will discuss how Clarity can be used to govern both types of work for teams, and how Agile tools should interface into Clarity.
 -
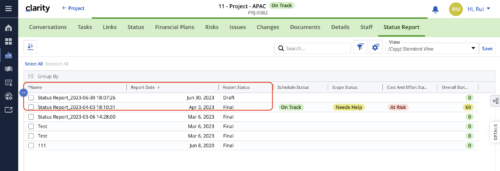 When marking a Status Report 'Final' in a grid/list view, the system doesn't create a new 'Draft' report like it does when using the Status Report UI. For groups that prefer to manage in a grid/list, they need to always have a draft.
 -
 Join Rego’s senior Agile guides and learn best-practice usage patterns to support your ART-level practices with Rally Software. We’ll explore all the ceremonies in a team-of-team (ART) program increment and how you can use Rally to align, simplify, and leverage for scaled delivery of high-value solutions.
 -
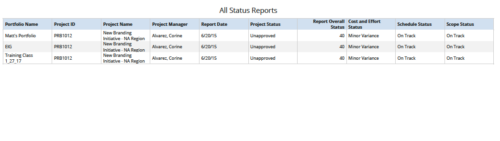 All Status Reports is a grid report that provides project managers a single place to current status report for a single project or across multiple projects. This report provides project information such as ID, Name, Manager, Status, Status report KPI’s (Report overall status, Cost and Effort status, Schedule status & Scope Status) and Portfolio Name. You can further narrow your search by OBS Type, OBS Path, Project Name, Project Manager, Status, Overall Status and Portfolio Name.
 -
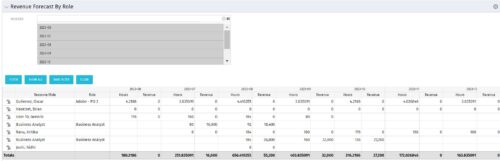 The Revenue Forecast by Role portlet displays forecasted revenue by both resource and role on the given project, broken out by month. The table below describes the available filter fields in the portlet.
Column Label Description Months Fiscal months to display -
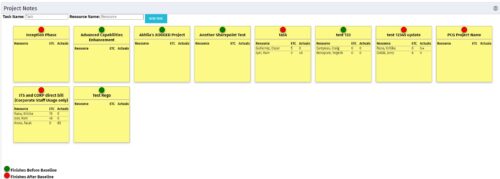 The Task-At-A-Glance Notes portlet provides a view of project tasks and assignments in an easy to read format, similar to popular sticky – note applications. This portlet will display all tasks on a project, ‘pinning’ them to a dashboard. Each task will include the resources assigned to them, as well as the ETCs left for the resource, and the actuals that they have posted. Each sticky note allows you to link to the task details, as well as the resource assignment details. In addition to important assignment detail, each pin on the individual task’s note indicates if the task finishes before the baseline (green), or if it is going to finish after the baseline (red).
 -
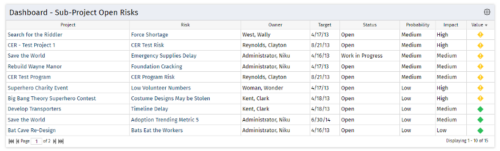 The Program Dashboard Sub-Project Open Risks portlet gives the ability to view all risks on the sub-projects of a program that are not closed or resolved. The portlet will pull the "id" from the page it is placed on, so this portlet is usually placed on the dashboard tab. The portlet sorts the issues first by value, in descending order, and then by target date. It displays the sub-project name, risk name, owner, target date, status, probability, impact and value.
 -
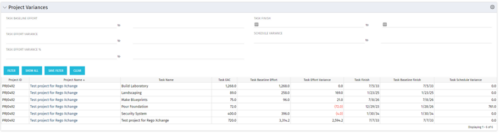 This Project Variances portlet provides a project manager a consolidated view of all of their active projects and open project tasks and shows them the baseline variance for the task EAC’s and the task start and finish dates. This gives the project manager a single place to view and manage how their projects are progressing against their baselines. The PM can easily detect when projects are running behind and pinpoint which tasks are causing the variance in the schedule.
 -
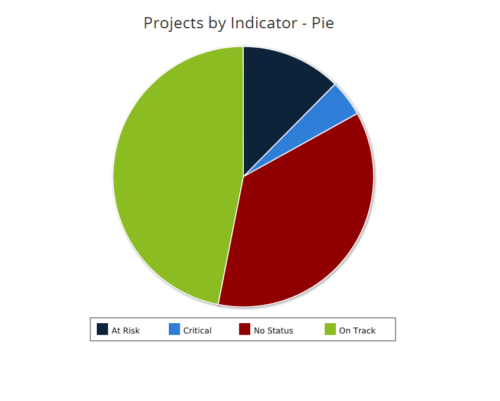 Projects by Status Indicator is a pie chart that displays count of projects by out of box Status Indicator attribute. Legend displays the colors associated with various Status Indicator values. Mouse over the pie chart slice displays the count of projects associated with that respective Status Indicator value. You can further narrow your search by OBS Path, Project Manager and Is Project Active?.
 -
 This portlet displays Actual Time by Project over a span of time. It supports Annual, Quarterly, Monthly, and Weekly time periods. The time span displayed is controlled by a filter field for the Start Date (of the time span) and by a filter field for the Number of Time Periods to be displayed. There are also filters for Project name, Project Manager, and Project Type.
 -
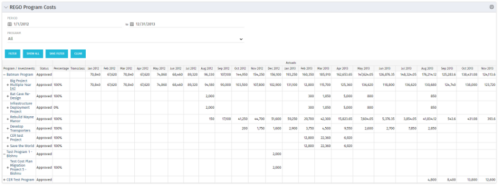 The Program Costs portlet looks like a cost plan. It will summarize all cost plans from projects within the program and display the totals.
 -
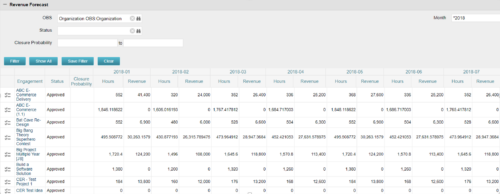
The Revenue Forecast portlet displays projected revenue at a project level broken out by month. This portlet assists in viewing all project revenue data at once and making it easily exportable. The table below describes the available filter fields in the portlet. Column Label Description OBS OBS to filter projects with Status Status of the project Closure Probability ? Months Month(s) of Project Revenue to display -
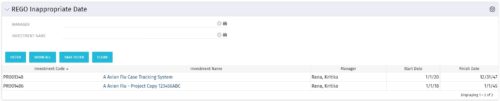 This grid portlet to show projects with finish or start date of project more than 20 years in future or past. The portlet automatically displays results when accessed. The user can apply filters to fetch the desired information.
 -
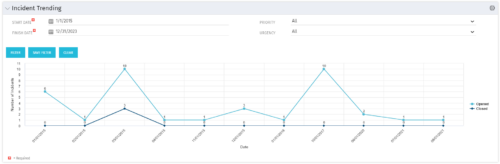 The Incident Trending portlet all opened and closed incidents within a certain time frame. This portlet will show trends in incidents over previous months and allows for analysis of as to the root cause in a spike of incidents. The information may be filtered by date range, urgency and priority.
 -
 This training document is a Rego Consulting Quick Reference Guide to assist with the management of the Grid View within Hierarchies in Clarity’s Modern User Experience. This doc references version 16.0.3 views. Document covers information on how to export to CSV, filter, create and save Views, use of the Column Panel and the Details panel.
 -
 This training document is a Rego Consulting Quick Reference Guide to assist in the replacement of roles with named resources in Clarity’s Modern User Experience. This doc references version 16.0.3 views. Document provides detail on soft bookings, default allocation and requested manager. Instructions are provided on how to access requests from the Staffing Plan view and how to swap the role for a named resource. If requests are not fulfilled in their entirety, details are provided on how the excess allocation is handled.
 -
 This training document is a Rego Consulting Quick Reference Guide to assist with the management of Project Tasks via the PPM Gantt view in Clarity’s Modern User Experience. This doc references version 16.0.3 views. Doc covers PPM Gantt, View Legend, Menu Icons, Create New Task, Indent Tasks, Move Tasks and Set Dependencies.
 -
 This training document is a Rego Consulting Quick Reference Guide to assist resource managers with the adjusting of timesheets. This doc references version 16.0.3 views. Document provides guidance on how to use the Review & Approve tab to adjust time that has already been entered by a resource.
 -
 This training document is a Rego Consulting Quick Reference Guide to assist with the utilization of some of the most common components in Clarity’s Modern User Experience. This doc references version 16.0.3 views. Document includes content on Grid View, View Options, Adjust Columns, Details Panel, Group By, Save Views and Manage Views.
 -
 This training document is a Rego Consulting Quick Reference Guide to assist with the management of Project Tasks via the PPM Gantt view in Clarity’s Modern User Experience. This doc references version 16.0.2 views. Doc covers PPM Gantt, View Legend, Menu Icons, Create New Task, Indent Tasks, Move Tasks and Set Dependencies.
 -
 This training document is a Rego Consulting Quick Reference Guide to assist with the utilization of some of the most common components in Clarity’s Modern User Experience. This doc references version 16.0.2 views. Document includes content on Grid View, View Options, Adjust Columns, Details Panel, Group By, Save Views and Manage Views.
 -
 This training document is a Rego Consulting Quick Reference Guide to assist with the utilization of the My Workspace area within Clarity’s Modern User Experience. This doc references version 16.0.2 views. Document reviews Checklists, Smartlists and To Do’s.
 -
 A Quick Reference Guide to assist with Task Assignments in Clarity. The document shows screen shots from the Classic UX with the Phoenix theme.
 -
 A Quick Reference Guide to assist in the process of staffing a Project Team in Clarity. The document uses screen shots from the Classic UX with the Phoenix theme.


Copyright 2023 • Rego Consulting Corporation • Privacy Policy