-
 “Resources with No Basic Matrix Entry” portlet displays combinations of project and resource where the assigned resource does or does not have a rate established for that project. Portlet is filterable by Projects, Project ID, Resources, and Missing Rate (Yes, No, All). How does this work? The Rate Matrix Extraction job populates a record into the NBI_PROJ_RES_RATES_AND_COSTS table for every resource/project combination that meets any of the rate matrix criteria. This portlet checks that table, and sets the Missing Rate attribu
 -

 The portlet shows the project spend to vendors by month. The Vendor field picked on the portlet comes from the Vendor mentioned when creating the voucher (as displayed on the first screenshot). This provides a nice view of identifying how much is spent by an organization on the vendor employees on their workforce.
 -
 Part of the Business Transformations collection, this portlet displays planned revenue as defined by a project whose goal is "Grow the business". It uses the Planned Revenue Query as a data provider. This portlet provides a holistic overview of how many projects following the goal “Grow the Business” are Critical/ At Risk / On Track with regard to the planned revenue.
 -
 Part of the Business Transformation collection, this portlet displays count of the planned benefits (savings) per project manager. It also displays if any of the planned benefits are Critical/ At Risk / On Track, along with the total planned benefit amount.
 -
 Part of the Business Transformation collection, this pie chart portlet displays realized benefit, grouped by location of project. This provides the PM with a holistic view of benefits realized across the geographical locations.
 -
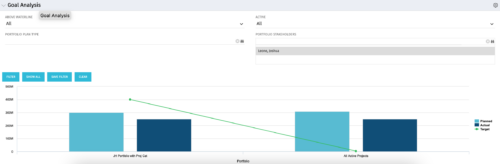 Part of our Business Transformation collection, this portlet relates exclusively to Benefit costs in the Portfolio and its investments. Portlet is a combination of Line Chart and Vertical Bar Charts. It displays data for one or more portfolios depending on rights and filters. Green Line represents Portfolio Target Benefits. Light blue bar represents aggregation of investment Planned Benefits. Dark blue bar represents aggregation of Investment Realized Benefits (actual benefits). Filtering is available for Above or Below Waterline investments OR all portfolio Investments. May also filter on Portfolio values as well as Plan values. Filtering also available for Active vs Inactive Portfolios.
 -
Part of our Business Transformation collection, this portlet relates exclusively to Benefit costs in the Portfolio and its investments. Portlet is a combination of Line Chart and Vertical Bar Charts. It displays data for one or more portfolios depending on rights and filters. Green Line represents Portfolio Target Benefits. Light blue bar represents aggregation of investment Planned Benefits. Dark blue bar represents aggregation of Investment Realized Benefits (actual benefits). Filtering is available for Above or Below Waterline investments OR all portfolio Investments. May also filter on Portfolio values as well as Plan values. Filtering also available for Active vs Inactive Portfolios.
-
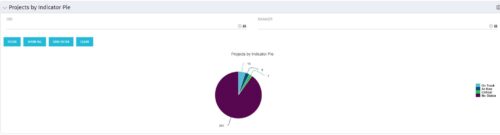 Pie Chart displays counts of all projects by out-of-box Status Indicator attributes. Filterable by OBS structure and Manager. Data label displays count. Mouse-over and Legend display Indicator name. Chart also displays count for projects with no Indicator.
 -
 The Time By Type - Pie Chart portlet is a graphical representation of time by type of investment for all resources the logged in user has security rights to view. This portlet pulls from the daily timeslices, and can be used for determining what types of projects receive the majority of hours. The filter option allows for entry of a specific start date and finish date.
 -
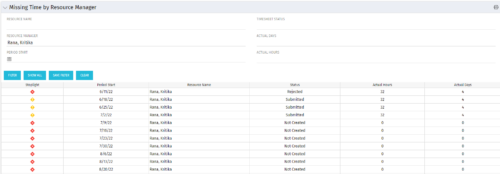 The Missing Time by RM portlet displays all missing or late timesheets for resources for which the logged in user has resources (logged in user is the RM). Resources will be listed if they are open for time entry, have a track mode of Clarity, and have timesheet that is not posted (accommodates for hire and termination dates). Resource managers may use this portlet to determine the timesheet status of all resources in open time periods. The portlet will display an indicator based on timesheet status, the status, period start, resource name, and actual hours for the timesheet.
 -
 The Dashboard: Open Risks portlet gives an overview of all risks that are not closed or resolved for a single project. The portlet will pull the "id" from the page it is placed on, so this portlet is usually placed on the project dashboard tab. The portlet sorts the risks first by priority and then by target date. It displays the name, owner, target date, probability impact, and priority.
 -
 The Dashboard: Open Milestones portlet gives an overview of all milestones that are started or not started for a single project. The portlet will pull the "id" from the page it is placed on, so this portlet is usually placed on the project dashboard tab. The milestones are sorted by Due Date. It displays the name, Due Date, Baseline Date, Days Late (Due Date – Baseline Date), and Days Old (Current Date – Due Date).
 -
 This training document is a Rego Consulting Quick Reference Guide to assist with the creation of Benefit Plans in Clarity’s Modern User Experience. This doc references version 16.1 views. Doc provides detail on how to create a Benefit Plan, how to categorize Benefit Class and Benefit Subclass, how to add financial values to your Benefit Plan, and how to add the Benefit Plan to your Cost Plan.
 -
 This training document is a Rego Consulting Quick Reference Guide to assist with General Navigation in Clarity’s Modern User Experience. This doc references version 16.1 views. Doc reviews the Menu Bar and User Tool Bar. Document provides instructions on how to access blueprints, create a new blueprint and edit the fields available on the blueprint. Detail is also provided on how to update the modules, rules and actions associated with a blueprint. Instructions are listed to show the user how to modify the create from template page, how to add a new channel and how to set a default blueprint. Tips on the user of the API Attribute ID are also provided.
 -
 This training document is a Rego Consulting Quick Reference Guide to assist with the management of project tasks from within the Tasks tab in Clarity’s Modern User Experience. This doc references version 16.1 views. Document covers Task Tab, Timeline View, Board View, Grid View, adding and removing columns, saving views, task details, To Dos, Assignments, Links, Conversations and View Options settings.
 -
 This training document is a Rego Consulting Quick Reference Guide to assist with the management of Project Tasks via the PPM Gantt view in Clarity’s Modern User Experience. This doc references version 16.1 views. Doc covers PPM Gantt, View Legend, Menu Icons, Create New Task, Indent Tasks, Move Tasks and Set Dependencies.
 -
 This training document is a Rego Consulting Quick Reference Guide to assist with the creation of financial plans within Ideas in Clarity’s Modern User Experience. This doc references version 16.1 views. Document includes instructions on how to create cost plans, budget plans and benefit plans.
 -
 This training document is a Rego Consulting Quick Reference Guide to assist with the creation and management of Ideas in Clarity’s Modern User Experience. This doc references version 16.1 views. Doc covers creation of ideas, adding columns to the grid view and editing existing ideas.
 -
 This training document is a Rego Consulting Quick Reference Guide to assist with Entering and Submitting Time in Clarity’s Modern User Experience. This doc references version 16.1 views. Document includes Accessing & Selecting Timesheets, Populate Timesheet, Updating Timesheet, Submitting Timesheet and Entering Time for Someone Else.
 -
 This training document is a Rego Consulting Quick Reference Guide to assist resource managers with the approval of timesheets via the Review & Approve tab. This doc references version 16.1 views. Doc reviews accessing and selecting timesheets, reviewing submitted timesheets, approving timesheets, approving multiple timesheets, returning timesheets and the timesheet grid.
 -
 This training document is a Rego Consulting Quick Reference Guide to assist with General Navigation in Clarity’s Modern User Experience. This doc references version 16.1 views. Doc reviews the Menu Bar and User Tool Bar.
 -
 A presentation slide deck from Rego University 2022. The course outline for developing NSQL Portlets, Intermediate Level, for Clarity.
- Chart Portlets
- Types / Uses
- Creating a sample portlet
- Limitations
- Drilldown Portlets
- Overview
- Example
- Other Examples and Assets
- Chart Portlets
-
 A presentation slide deck from Rego University 2022. This document reviews the reasons for and the steps to migrate to Clarity’s Modern User Experience.
- Introduction
- Why?
- Migration Strategies
- Planning the Pilot
- Tactical Checklist
-
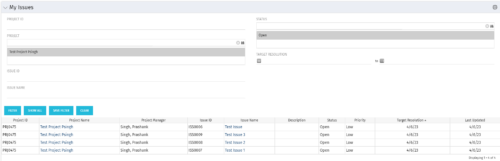 The My Issues portlet displays all issues within active project that the logged in user is assigned to. The portlet provides the logged in user a single place to view issues across multiple projects without having to go into each project individually. The filter then allows the user to narrow their search by Issue ID, Issue Name, Project ID, Project Name, and Issue Status. You may also narrow the view to display issues with a target resolution date within a certain date range.
 -
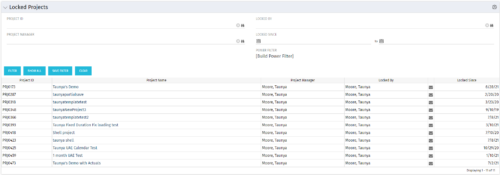 The Locked Projects portlet displays all of the projects in the system that are currently in a ‘locked’ state. The user may view the project ID, Project Name, Project Manager, the user who locked the project, the user's email address, and the date the project was locked. Administrators may utilize the data in this portlet in order to determine if a manual unlock should be executed on a project that has been locked for an extended period of time. Extended locks may indicate the individual has forgotten that he or she had obtained the lock. The portlet includes a hyperlink on the Project Name field, which will allow the administrator to more easily access and unlock the project as well as an email link to mail the user who locked the project.
 -
 The Executive Dashboard portlet displays information regarding projects the user has security rights to view. It provides a one-stop place for the PMO or management to view all critical information about projects. The portlet not only displays status indicators as well as dates for late items, variances and days late, but also displays the project status fields from the Status Report sub-object.
 -
 The Resource Data Issues portlet is used to identify data exceptions related to resource setup. This portlet helps to identify where resources are missing key data or are possibly sitting in an exception state. This view will show resources that have one or many exceptions, including inactive resources. There is no security built into this portlet - all resources will show. The only required field in the filter is Days, which is the number of days since the user last logged in. The user may also narrow the results by resource, OBS, or project type.
 -
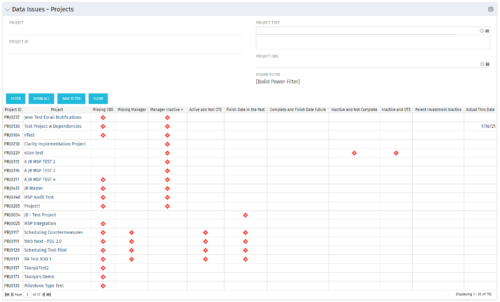 The Project Data Issues portlet is used to identify data exceptions related to project setup. This portlet helps to identify where projects are missing key data or are possibly sitting in an exception state. This view will show projects that have one or many exceptions, including inactive projects. The user may also narrow the results by project, OBS, or project type.
 -

 The Capacity Graph portlet displays Availability, Allocations, Actuals and Assignments for one or more active resource(s) in a single view. This portlet pulls data from timeslices, and allows the user to filter on a weekly, monthly or quarterly data. The Estimated Time to Complete (ETC) and Allocation data will only show for projects that are active. This portlet provides Resource Managers, PMOs and Executives with a simple way to analyse: Allocations vs. Availability, Allocations vs. Actuals, Allocations vs. ETC and ETC vs. Availability. The graph allows the user to determine where areas of improvement may exist and quickly identify potential areas of constraint. Note: the information displayed is dependent on what the user has security rights to view.
 -
 The All Assignments portlet displays resource assignments across multiple projects. Currently, assignment information displayed for the project, in OWB, or MSP is limited to a single project. This portlet will provide a single view of the assigned data for all assignments across multiple projects. The portlet displays project actuals and estimates from the project (datamart tables). The Days Late field is calculated by the baseline date, while the Days Old field is calculated by today's date. Note: Only the projects that the user has viewer rights to will show up in the list. Filters provide the PM, RM, and individual resource the ability to monitor work progress across multiple projects. For example: ~ PMs can filter for all assignments that were to be completed by a given date but still have "Started" or "Not Started" status. ~ If multiple projects are utilizing the same resource, the PM or RM can filter for assignments utilizing that specific resource to prevent over-utilization. ~ A resource may filter for all assignments assigned to them, providing a picture of their total body of work.
 -
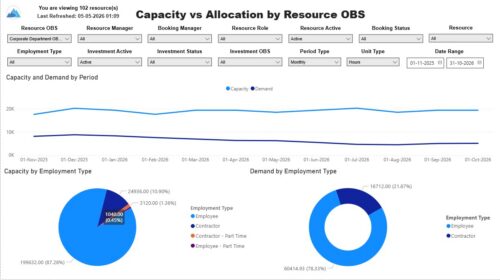 The Capacity vs. Allocation by OBS report displays resource capacity and demand across investments. The report can be grouped by any OBS level, providing visibility into resources at any level of the organization. The report displays amounts by week or month, and in total. The amounts can be displayed as hours or FTEs. Report Prerequisites Verify that you have completed the following prerequisites before you run this report: • Resource capacity amounts display if the resource has availability that is defined and meets the parameter criteria. • Resource demand allocation amounts display if the resource is allocated to at least one investment. Resource assignments are not required. • The Load Data Warehouse job must be run before you run this report. If the Data Warehouse is not populated, the report will not display any data. Also, most of the report parameters do not display options.
 -
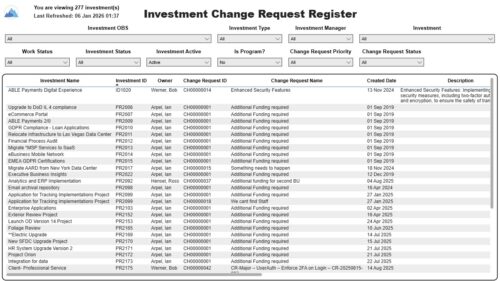 The Investment Change Request Register report displays comprehensive information for each investment change request. The report only includes investments where the Risk, Issues and Change modules are available. Report Prerequisites Verify that you have completed the following prerequisites before you run this report: • The investment must have at least one change request for the project to display in the report. • The change request properties must have fields such as description, change in cost, change in schedule, change in resources, category, expected close, approved by, approved date, and originating ID completed for them to display data in the report. The change request name, change request ID, priority, status, and owner are required in Classic PPM so they always display data. • The Load Data Warehouse job must be run before you run this report. If the Data Warehouse is not populated, the report will not display any data. Also, most of the report parameters do not display options.
 -
 This course will take a deeper dive into Clarity portlets. We'll take the next step after configuring object based portlets, and learn how to write an NSQL query to provide data to your portlet. We'll cover different types of portlets, grids, graphs, and multi-dimensional portlets, demonstrate how to surface the portlet on a page, and channel to it from Modern UX. Including HTML portlets and scripting tips.
 -
 Learn how Rego has invested $4.5 million dollars over the past two year to develop innovative enhancements and tools to get the most out of your investment in Clarity.
 -
 In today's business world, there are many threats to our ability to remain focused and productive. In this session we'll borrow learnings from sources like the best-selling book "Atomic Habits," other renowned thought leaders, and even from the worlds of sports, yoga, and meditation. We will discuss and practice some tools and methods you can begin using right away to improve your productivity while maintaining your own wellbeing and balance.
 -
 Do you want to talk to other customers that are using - or plan to use - Clarity's financial management capabilities? In this moderated Round Table, attendees can share experiences and provide insights on process, configurations, challenges, and successes. We will have an expert panel and then divide into small groups to discuss customer selected topics. 100% sharing, 100% learning.


Copyright 2023 • Rego Consulting Corporation • Privacy Policy