-
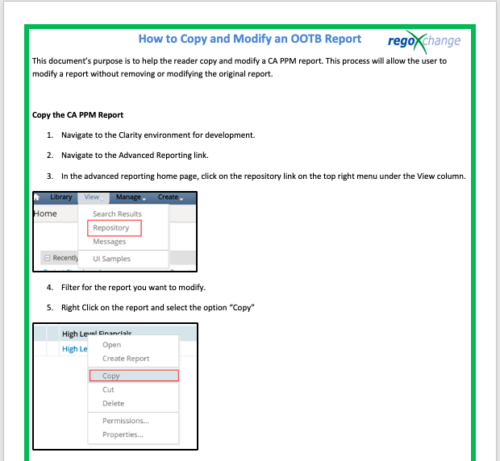 This document’s purpose is to help the reader copy and modify a CA PPM report. This process will allow the user to modify a report without removing or modifying the original report.
 -
 A tech trick document that assists you in update Data Source when utilizing the Power BI reports found in RegoXchange.
 -
 The Reset Admin Password technical trick provides the queries necessary to reset the administrator's password via the database. Passwords are forgotten, overwritten and misplaced often; using this technical trick, the support team will always have a back-up plan to gaining back access to the system.
 -
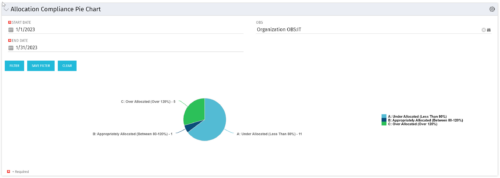 The Allocation Compliance Pie Chart portlet gives a view of active resources' allocation compliance within a date range and OBS displayed in a pie chart. It allows the user to the percentage of resources over, under, and adequately staffed on projects over a selected time period. This portlet leverages the daily allocation and daily availability slices as well as only active investments. The portlet provides filters for specific dates (required) and OBS.
 -
The Allocation Compliance Pie Chart portlet gives a view of active resources' allocation compliance within a date range and OBS displayed in a pie chart. It allows the user to the percentage of resources over, under, and adequately staffed on projects over a selected time period. This portlet leverages the daily allocation and daily availability slices as well as only active investments. The portlet provides filters for specific dates (required) and OBS.
-


The Percent Time by Type and Timescale - Grid portlet shows a breakout of time by timescale for resources the logged in user has view rights for using the timeslices. This portlet gives the Clarity user the ability to show the amount of hours spent on a project by week, month, quarter and year. Using this portlet, the Clarity user can get an overview of all hours in a time period or use the filter to search for a specific dataset (as required). The portlet provides a filter for OBS and date ranges. -
The Percent Time by Type and Timescale - Grid portlet shows a breakout of time by timescale for resources the logged in user has view rights for using the timeslices. This portlet gives the Clarity user the ability to show the amount of hours spent on a project by week, month, quarter and year. Using this portlet, the Clarity user can get an overview of all hours in a time period or use the filter to search for a specific dataset (as required). The portlet provides a filter for OBS and date ranges. -
The Percent Time by Type and Timescale - Grid portlet shows a breakout of time by timescale for resources the logged in user has view rights for using the timeslices. This portlet gives the Clarity user the ability to show the amount of hours spent on a project by week, month, quarter and year. Using this portlet, the Clarity user can get an overview of all hours in a time period or use the filter to search for a specific dataset (as required). The portlet provides a filter for OBS and date ranges. -
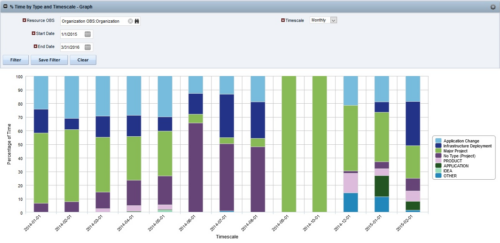
 The Percent Time by Type and Timescale - Graph portlet shows a breakout of time by timescale for resources the logged in user has view rights to. This portlet gives the Clarity user the ability to show the amount of hours spent on each project type by week, month, quarter and year. Using this portlet, the Clarity user can get an overview of all hours in a time period or use the filter to search for a specific dataset (as required). The portlet provides a filter for OBS and date ranges.
 -
 RegoU Presentation from February 2014. Creating a security model that is overly complex and difficult to modify and maintain is easy to do when trying to implement tight security within Clarity. In this session, you will learn some key concepts when designing and implementing security. Additionally, Rego’s team of experts will share tips and tricks for automating security, as well as ways to monitor the Clarity rights that individuals have. The video Presentation can be found on YouTube at this location: https://www.youtube.com/watch?v=dH_UH7rySZM&feature=youtu.be
 -
 A presentation slide deck from Rego University 2022. This course in the Apptio track was about analyzing cost drivers to understand why cost could be changing.
- Questions we’re looking to answer
- Scenarios
- Tools
-
 A presentation slide deck from Rego University 2022. This course was about understanding TBM and positioning its value with your organization. • What is TBM • TBM Value • A TBM “Transformation” • TBM Value in Practice
 -
 A presentation slide deck from Rego University 2022. A class about the goal of TCO and what it takes to achieve it.
- TCO Benefits
- Best Practices
- Deployment Tips
-
 A presentation slide deck from Rego University 2022. A course to improve your use of TBM Studio.
- References
- Managing builds
- Viewing your model and tracing data
- Using documentation options within TBM Studio
- Project Explorer Tricks
- Table Tricks
- Metric Tricks
-
 A presentation slide deck from Rego University 2022. This course was a review of the power of perception and how to improve on the adoption of Apptio.
- The Perception of Apptio
- The Perception of Adoption
- Driving Adoption
- Measuring Success
-
 A presentation slide deck from Rego University 2022. This course taught an Agile approach to managing finances.
- IT Planning Essentials
- Common Practices & Challenges
- Leading IT Planning Approaches
- Continuous Planning vs Annual Planning
-
 A presentation slide deck from Rego University 2022. A review of the best practices in IT Planning from an Apptio perspective.
- Custom layouts
- Bookmarks
- Dropdown and autofill
- Cost object permissions
- Dashboard reports
- Targets
- Change history / Event Log
- Data input enforcement
- Managing archive
- Stay on top of product updates
-
 A presentation slide deck from Rego University 2022. A class on building a defensible cost model.
- Characteristics of a defensible model
- Steps to build an accurate TBM model
- Allocation best practices
-
 A presentation slide deck from Rego University 2022. This class reviewed the importance of an application health check, optimization and tuning.
- Checking Apptio Version
- Tools Overview
- Configuration Tips
-
 A presentation slide deck from Rego University 2022. This course reviewed the value of a strategic roadmap for TBM.
- Defining the Value of a Strategic Roadmap
- Roadmapping Methodology
- Best Practices
- TBM Roadmap Examples
-
 A presentation slide deck from Rego University 2022. This course reviews the new release features in ApptioOne.
- Where to find new releases
- Apptio BI
- ApptioOne
- Editable Tables
-
 A presentation slide deck from Rego University 2022. An outline of topics used for a Apptio Round-Table discussion.
 -
 A presentation slide deck from Rego University 2022. This class reviewed Apptio reporting options, tips & tricks, etc.
- Introduction
- Reporting Options for Apptio
- Reporting Tips & Tricks
- Reporting best practices
- Custom Report Showcase
-
 A presentation slide deck from Rego University 2022. This deck reviews Apptio’s self-service reporting tool. This tool is geared towards end users and empowers them to create and share their own reports.
 -
 Are you struggling with implementing Agile tools in your organization in addition to CA PPM? This class will review best practices for implementing agile tools in conjunction with CA PPM - living in a Bi-Modal world. We will discuss how CA PPM can be used to govern both types of work and teams and how Agile tools should interface into CA PPM.
 -
 Course description: “People are the #1 key to successful implementation, acceptance and sustaining adoption after the project is long gone. Find out some tips and tricks on how to keep those key stakeholders engaged.” Download file is the presentation slide deck.
 -
 Are you considering moving to CA PPM SaaS? This class will provide lessons learned while we walk you through business cases, conversion time-lines, and the advantages of both hosting strategies.
 -
 Expand your training delivery options beyond MS Word and PowerPoint. Discuss the various training delivery mechanisms, and how to choose the right delivery method and combination of materials for the different types of courses you’ll deliver to your end users.
 -
 Tight budgets or disbursed teams often necessitate virtual training delivery. Discuss best practices and strategies to increase the effectiveness of your virtual courses.
 -
 Maximize the value of your training delivery by increasing end user engagement with the course content. Discuss options to optimize efficiency and help ensure users are engaged while participating in training.
 -
 Does project and idea estimation take too long and lack visibility? This class will address one of the most common pain points within organizations: how to involve the right people within a timely project estimate. Learn Rego’s model for defining, calculating, and modifying idea and project estimates, so you can increase throughput and ROI.
 -
 Are you ready to go beyond simple graph and grid portlets? This class will show you how to create and export portlets with hierarchical structure and drill-down capability, and includes examples of advanced portlets and complex queries.
 -
 CA has advertised the addition of RESTful APIs into the core product in version 14.3. What does this mean to you? What does this do to help you support CA PPM? This class will review the new APIs and discuss what they enable for you.
 -
 Have you ever experienced the downside of metrics? This class is a working session that review different types of metrics and the problems they uncover as well as the problems they can cause. Learn how to balance your positive and negative metric impacts.
 -
 Do you want to improve the success of your CA PPM projects? This class will discuss some lessons learned on making CA PPM projects more successful. We will discuss things like
- developing robust test plans, creating effective use and test cases, and implementing test scripts that make sense.
- why failures occur, and what you can do to minimize the impact and plan for success: case study in lessons learned.
- developing, testing, fine tuning, and executing deployment plans for success.


Copyright 2023 • Rego Consulting Corporation • Privacy Policy