-
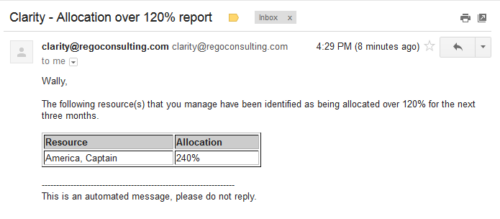 Based on the pre-determined schedule frequency, this job will send an email to Resource Managers that have a Resource meeting the criteria of: Average allocations are greater than 120% where Resource(s) and Project(s) are active over the next 90 days. This serves as a reminder to Resource Managers to monitor and manage allocations. The contents of the email include a message indicating the Resource Manager has at least one Resource meeting this criteria and a table indicating the Resource and that resource’s average, next 90 days allocations.
 -
 Based on the pre-determined schedule frequency, this job will send an email to Resource Managers that have a Resource meeting the criteria of: Average allocations are less than 100% where Resource(s) and Project(s) are active over the next two weeks. This serves as a reminder to Resource Managers to monitor and manage allocations. The contents of the email include a message indicating the Resource Manager has at least one Resource meeting this criteria and a table indicating the Resource and that resource’s average, next 90 days allocations.
 -
 Based on the pre-determined schedule frequency, this job will send an email to Resource Managers that have a Resource meeting the criteria of: Average allocations are less than 100% where Resource(s) and Project(s) are active over the next two weeks. This serves as a reminder to Resource Managers to monitor and manage allocations. The contents of the email include a message indicating the Resource Manager has at least one Resource meeting this criteria and a table indicating the Resource and that resource’s average, next 90 days allocations.
 -
 Based on the pre-determined schedule frequency, this job will send an email to Resource Managers that have a Resource meeting the criteria of: Average allocations are less than 100% where Resource(s) and Project(s) are active over the next two weeks. This serves as a reminder to Resource Managers to monitor and manage allocations. The contents of the email include a message indicating the Resource Manager has at least one Resource meeting this criteria and a table indicating the Resource and that resource’s average, next 90 days allocations.
 -
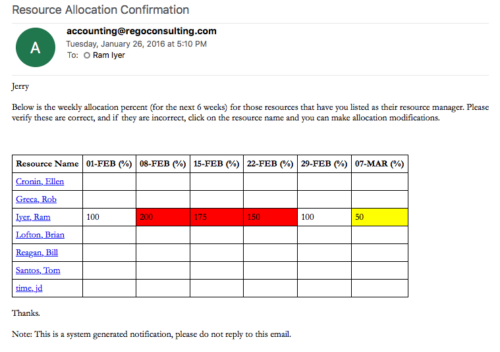
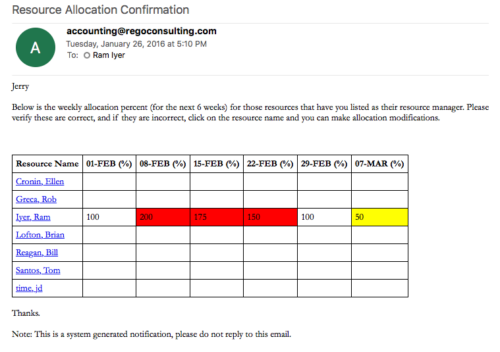 Process provides the RM with assigned resources availability percentage for the next four weeks. Grid displays all resources with their total allocated hours by week, and an average availability percent (4 Wk Avail %) for next four weeks. If % Available is negative, this indicates an over-allocation. Zero% Average Availability indicates fully allocated (no remaining availability). Links at the resource name allow for modifications by the RM.
 -
 Process provides the RM with assigned resources availability percentage for the next four weeks. Grid displays all resources with their total allocated hours by week, and an average availability percent (4 Wk Avail %) for next four weeks. If % Available is negative, this indicates an over-allocation. Zero% Average Availability indicates fully allocated (no remaining availability). Links at the resource name allow for modifications by the RM.
 -
 Process provides the RM with assigned resources availability percentage for the next four weeks. Grid displays all resources with their total allocated hours by week, and an average availability percent (4 Wk Avail %) for next four weeks. If % Available is negative, this indicates an over-allocation. Zero% Average Availability indicates fully allocated (no remaining availability). Links at the resource name allow for modifications by the RM.
 -
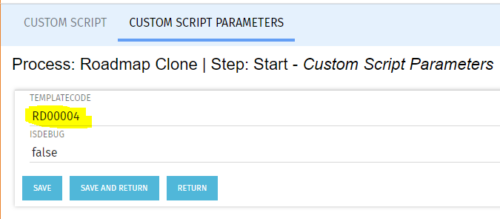
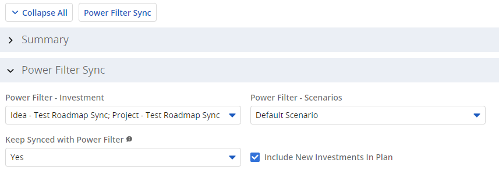 The Power Filter Sync functionality allows users to define rules for syncing investments to Roadmaps or Hierarchies on a scheduled (and on-demand in Roadmaps only) basis. Users may choose one or more saved views from investments that are allowed on the Roadmap/Hierarchy to define the list of investments they want that Roadmap/Hierarchy to contain. If the option to Keep Synced with Power Filter is set to Yes, then each time the process runs, the Investments returned by the saved views will be added to the Roadmap/Hierarchy if they don’t exist there already, and any investment not found in the saved views will be removed.
 -
 Out of the box, there is no way to export or report on the Modern UX Roadmap Grid view. This report allows the end user to select one or more roadmaps and provides an exportable view of several OOTB fields from those roadmaps. When exported to and open in excel, the first tab will display a combined view of all selected Roadmaps, one row for every Roadmap Item, and additional tabs will display Roadmap-specific views. Custom attributes may be added to the report by your developers.
 -
 Out of the box, there is no way to export or report on the Modern UX Roadmap Grid view. This report allows the end user to select one or more roadmaps and provides an exportable view of several OOTB fields from those roadmaps. When exported to and open in excel, the first tab will display a combined view of all selected Roadmaps, one row for every Roadmap Item, and additional tabs will display Roadmap-specific views. Custom attributes may be added to the report by your developers.
 -
 Do you want to talk to other customers that are using or plan to use portfolio management? In this moderated Round Table where customers can share experiences and provide insights on process, configurations, challenges, and successes. We will have an expert panel and then divide into small groups and discuss customer selected topics - 100% sharing.
 -
 Do you want to talk to other Clarity customers that are using - or plan to use - portfolio management capabilities? In this moderated Round Table, participants can share experiences and provide insights on process, configurations, challenges, and successes. We will have an expert panel and then divide into small groups to discuss customer selected topics - 100% sharing. 100% learning.
 -

 The Rego Roadmap Ranking provides the ability to rank Roadmap Items within individual Roadmap Scenarios. The function allows the user to define a hierarchical sequence to defined attributes to create a set of rules to generate an auto-ranking, by scenario. Large sets of ranking rules increase complexity and variability, so choose initial rules carefully. When the rank order is configured, a process is actioned that auto-ranks the Roadmap Items for the selected Roadmap Scenario. The Roadmap Ranking can be viewed through the Timeline, Board, or Grid View.
 -
 Hierarchies and Roadmaps are two powerful capabilities that Clarity has brought to the market. While they work great independently, have you experimented with how they can work together, even better? In this session, come and learn how these two capabilities can complement each other by working in concert giving you both planning and execution insights!
 -
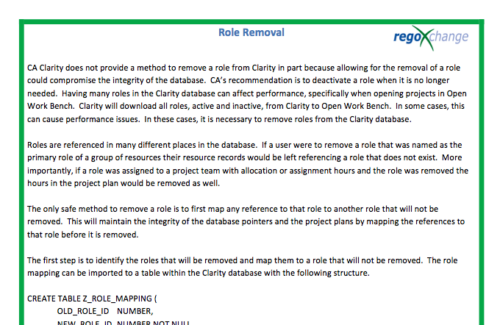 In many instances, having excess information stored within the database can cause poor performance or slowness when retrieving data. Administrators are always seeking out ways to clean and remove unused information. This technical trick on role removal provides the steps necessary to remove roles that would otherwise be unused and eliminating unwanted information. The Role Removal Technical Trick provides the information for the creation of the following tables and columns which are necessary to perform the role removal:
- Role – mapping table
- Tables / Columns that need to be updated with Resource ID fields
- Tables / Columns that need to be updated with Role Code fields
- Tables that will need to be deleted
- PRTEAM table should be checked
-
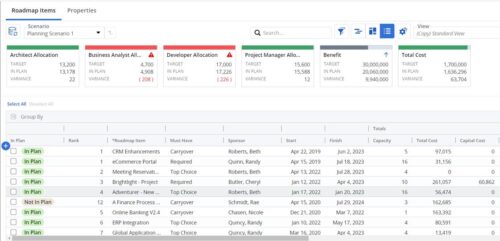 This Roadmap add-on provides configurable Role-based metrics that can be used in the grid view as targets and constraints. Select your valuable roles in the “targets” and once selected, the “sync” button will bring in any current allocations against projects and allow editing any of the total numbers directly in a scenario. This will provide deeper insights into impacts of plans on teams/resources in addition to the out of the box money and time constraints.
 -
 Course Description: What is Technology Business Management (TBM) or IT Financial Management (ITFM)? Why is it important for IT? This session explores the need for TBM as well as how it drives significant cost optimization and more effective business-technology management practices. We will review the TBM framework, taxonomy, model, and how TBM processes and tools compliment your existing investment in PPM tools.


