-
 Course Description: Have you ever wanted to build portlets that were not limited by Clarity PPM's out-of-the-box portlet types? This class will explore some of the options you can use to build helpful portlets with HTML, including calendars, Kanban boards, tile-based project lists, and some special Star Wars-themed communication portlets.
 -
 Do you want to understand the OOTB configuration and functionality of roadmap management? In this class, we will review the OOTB objects, views, and functions of roadmap management.
 -
 What integrations are the most requested and the most utilized? This class will review the most common interfaces to and from Clarity, including best practice use cases and lessons learned from real implementations.
 -
 Are you struggling with implementing Agile tools in your organization in addition to Clarity? This class will review best practices for implementing agile tools in conjunction with Clarity - living in a Bi-Modal world. We will discuss how Clarity can be used to govern both types of work and teams and how Agile tools should interface into Clarity.
 -
 This training document is a Rego Consulting Quick Reference Guide to assist with the management of Roadmap items within the Grid View in Clarity’s Modern User Experience. This doc references version 16.1 views. Instructions are provided to help users add and remove columns, move columns, pin columns and sort rows of data. The document provides guidance on how to use the View Options function to manage Per-Period Metrics. Includes guidance on how to update Roadmap data from the Grid View and how to use the In Plan column to rank investments.
 -
 A presentation slide deck from Rego University 2022. A course outline document reviewing the innovative offerings from Rego. This course reviewed RegoXchange, Action Item Responder, Excel Data Manager, and innovations around Office 365.
 -
 A presentation slide deck from Rego University 2022. This document is course material for an Advanced Admin class for Clarity’s Modern UX. Focus on this class was on Blueprints.
- A presentation slide deck from Rego University 2022. This document is course material for an Advanced Admin class for Clarity’s Modern UX. Focus on this class was on Blueprints.
- Pages
- Modules - Channels
- Rules
- Fields Level Security
- Actions
- A presentation slide deck from Rego University 2022. This document is course material for an Advanced Admin class for Clarity’s Modern UX. Focus on this class was on Blueprints.
-
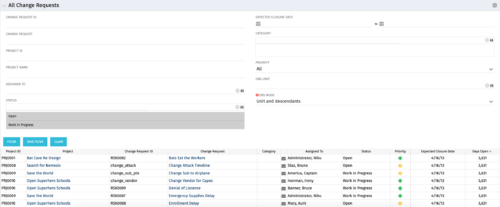 The All Change Request portlet displays all change requests related to active projects that the logged in user has view rights to. The portlet provides the project manager a single place to view change requests across multiple projects without having to go into each project individually and allows for more efficient management and reporting across projects. The filter allows the user to narrow their search by date ranges, resources involved, and/or the project with which the Change Request is associated. Other alternatives for filtering include the category, priority or status of the Change Request. In the list view, a status is displayed for each Change Request (CR), along with the Project with which the CR is associated, the CR ID, the CR name, the resource to whom the CR is assigned, Priority, Expected Closure Date, and number of days the CR has remained open. Note: Only the projects that the user has viewer rights to will show up in the list.
 -
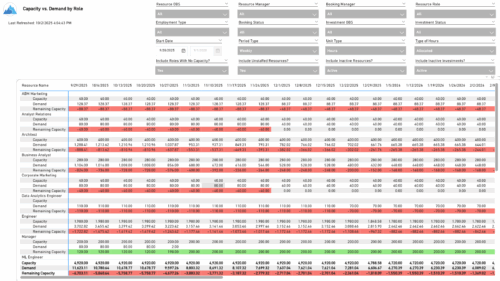 The Capacity vs. Demand by Role report provides visibility into resource utilization by comparing available capacity to actual demand across investments at the role level. It highlights capacity, demand, and remaining capacity, helping identify potential surpluses or shortfalls. Data can be viewed by week or month and displayed in either hours or full-time equivalents (FTEs) to support detailed workforce planning and analysis.
 -
 This class is a hands-on beginner training class on Clarity's native functionality for reporting. Learn how to build basic visuals/reports and leverage Canvas to get the most out of Clarity.
 -
 A Quick Reference Guide to assist in the administrative process of adding an attribute to a Clarity object. Attributes store information associated with object views. For example, Start and Finish are a Date type attributes and Project Type is a lookup type attribute on the Project object.
 -
A Quick Reference Guide to assist in the process of adding members to a Group in Clarity’s Modern User Experience. A group is a collection of users that require the same set of access rights. Members (users) can be added to a group.


Copyright 2023 • Rego Consulting Corporation • Privacy Policy