-
 The Time by Stage portlet displays time logged to each project task stage. The portlet displays the project id, project name, task stage, and charge code for each different task stage on the project. This portlet provides management with a quick view of all project task stages by project without having to navigate into each project individually.
 -
The Time by Stage portlet displays time logged to each project task stage. The portlet displays the project id, project name, task stage, and charge code for each different task stage on the project. This portlet provides management with a quick view of all project task stages by project without having to navigate into each project individually.
-
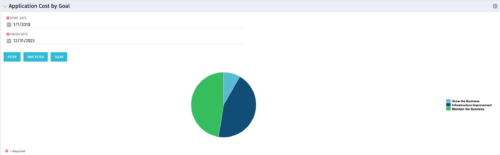 The Application Cost by Goal portlet displays the planned cost of all active applications within a user-defined timeframe, summarized by goal in a pie chart. This portlet provides management with a quick overview of cost by goal within a year without navigating to each application individually.
 -
The Application Cost by Goal portlet displays the planned cost of all active applications within a user-defined timeframe, summarized by goal in a pie chart. This portlet provides management with a quick overview of cost by goal within a year without navigating to each application individually.
-
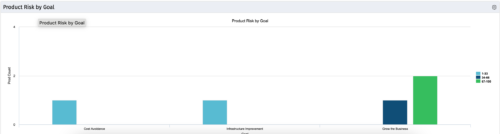 The Product Risk by Goal portlet displays a count of active products by goal with a sub-count by risk. The graph is color-coded by risk rating:
- 1-33 – Green
- 34-66 – Yellow
- 67-100 – Red
-
The Product Risk by Goal portlet displays a count of active products by goal with a sub-count by risk. The graph is color-coded by risk rating:
- 1-33 – Green
- 34-66 – Yellow
- 67-100 – Red
-
 The Changing Application Logo and Title tech trick provides an overview of how to change the logo and title within the application. This allows administrators to rebrand Clarity to their own logo and title. By customizing the logo, employees may be more encouraged to take ownership of the tool.
 -
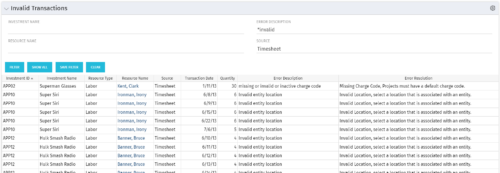 The Invalid Transactions portlet displays all of the transactions that did/will not post in Clarity. The benefit of this portlet is that you can use the filter to select a specific project, resource, or error to display all transactions associated to your selection. There are several reasons a transaction may fail to post such as inactive resource, no location or inactive location selected on the Financial sub-page, project on hold, etc. To resolve the error, the user must go into the project or resource and make the noted change. Once all corrections are complete, the Post Transactions to Financials job must be run to evaluate the corrected WIP transactions to be sure the data is now complete and accurate. If additional incorrect data is found, the transaction will fail to post again and the new error/reason will display.
 -
The Invalid Transactions portlet displays all of the transactions that did/will not post in Clarity. The benefit of this portlet is that you can use the filter to select a specific project, resource, or error to display all transactions associated to your selection. There are several reasons a transaction may fail to post such as inactive resource, no location or inactive location selected on the Financial sub-page, project on hold, etc. To resolve the error, the user must go into the project or resource and make the noted change. Once all corrections are complete, the Post Transactions to Financials job must be run to evaluate the corrected WIP transactions to be sure the data is now complete and accurate. If additional incorrect data is found, the transaction will fail to post again and the new error/reason will display.
-
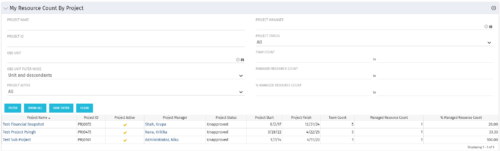 The My Resource Count by Project portlet displays project information, total team count and the current user’s resource count assigned to each project. The user may narrow the results by filtering on project name, manager, status, team count, managed resource count or percentage managed resource count. Using this portlet, resource managers can quickly identify which projects their resources are allocated to without having to navigate to each resource individually. Not only does this portlet display the overall team count on the project (team count), but it also displays the managed resource count (logged in user’s number of resources allocated to the project) as well as the percentage of managed resource count to team count.


Copyright 2023 • Rego Consulting Corporation • Privacy Policy