RegoXchange
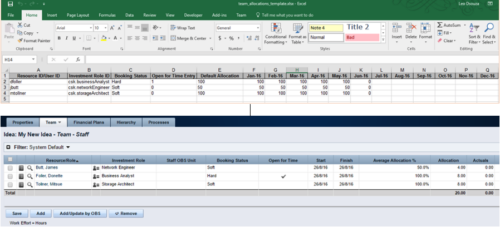
  • The idea allocation uploader allows you to import in allocations from an external Excel spreadsheet.  Populate an Excel template with required fields then import them directly from the Clarity UI.  Once imported you’ll see the allocations right on the Team tab of the Idea.
  • This portlet uses a bar graph to show the count of ideas by stage - grouped by the sponsor OBS. The X-axis displays the count and the Y-axis denotes the sponsor.
  • This portlet uses a bar graph to show the count of ideas by stage - grouped by the sponsor OBS. The X-axis displays the count and the Y-axis denotes the sponsor.
  • This portlet uses a bar graph to show the count of ideas by stage - grouped by the sponsor OBS. The X-axis displays the count and the Y-axis denotes the sponsor.
  • A Quick Reference Guide to assist in the creation of Financial Plans for Ideas in Clarity’s Modern UX.  In Modern UX you can only create Manual Financial Plans. Go to Classic if you want to create a Cost Plan from Investment Team a Budget Plan or Benefit Plan.
  • This training document is a Rego Consulting Quick Reference Guide to assist with setting up financial plans for ideas in Clarity’s Modern User Experience.  The document reviews Ideas Cost Plans and Idea Budget Plans.
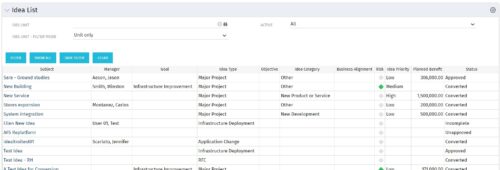
  • Part of the Business Transformation collection, this grid portlet displays idea details for all ideas (active and inactive) and all status conditions.  This is an editable portlet based on the Ideas data provider.  Filterable by OBS structure, Active/Inactive, and Status.
  • Part of the Business Transformation collection, this grid portlet displays idea details for all ideas (active and inactive) and all status conditions.  This is an editable portlet based on the Ideas data provider.  Filterable by OBS structure, Active/Inactive, and Status.
  • Part of the Business Transformation collection, this grid portlet displays idea details for all ideas (active and inactive) and all status conditions.  This is an editable portlet based on the Ideas data provider.  Filterable by OBS structure, Active/Inactive, and Status.
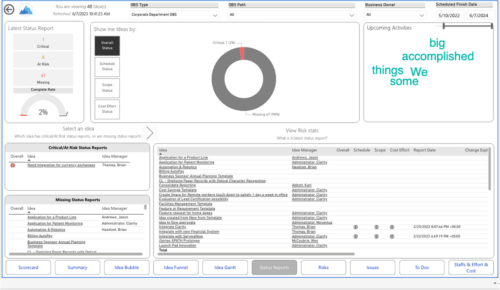
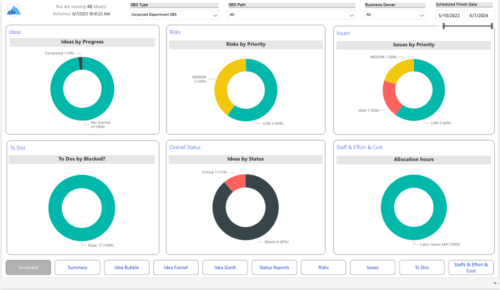
  • Master your pipeline as you prioritize, visualize, and analyze ideas, assess their feasibility, and track progress from inception to execution. Report Views include: • Idea Bubble • Idea Details • Idea Funnel • Idea Gantt • Idea Overview • Idea Staff and Effort • Idea Status • Idea To Dos Demo Video - https://www.youtube.com/watch?v=xPSxOlrqEq8&list=PLXJ5ktuWV0jiS9CvBpHvBIwpKPmA9uvwK&index=3 The main .rpt file will access data through the Data Warehouse. For clients on Rego’s AWS hosting, we have versions that work with Oracle and Postgres DB and access the live database, if the Rego Odata connector is being used.
  • Master your pipeline as you prioritize, visualize, and analyze ideas, assess their feasibility, and track progress from inception to execution.  Report Views include:
    • Idea Bubble
    • Idea Details
    • Idea Funnel
    • Idea Gantt
    • Idea Overview
    • Idea Staff and Effort
    • Idea Status
    • Idea To Dos
    Demo Video - https://www.youtube.com/watch?v=xPSxOlrqEq8&list=PLXJ5ktuWV0jiS9CvBpHvBIwpKPmA9uvwK&index=3 The main .rpt file will access data through the Data Warehouse.  For clients on Rego’s AWS hosting, we have versions that work with Oracle and Postgres DB and access the live database, if the Rego Odata connector is being used.
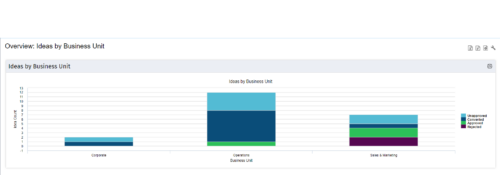
  • Part of the Business Transformation Content collection, this bar chart portlet displays count of ideas per business unit. This provides a holistic view of the idea pipe-line in an organization providing them a high-level of ideas converted, approved, unapproved per business unit.
  • Part of the Business Transformation Content collection, this bar chart portlet displays count of ideas per business unit. This provides a holistic view of the idea pipe-line in an organization providing them a high-level of ideas converted, approved, unapproved per business unit.
  • Part of the Business Transformation Content collection, this bar chart portlet displays count of ideas per business unit. This provides a holistic view of the idea pipe-line in an organization providing them a high-level of ideas converted, approved, unapproved per business unit.
  • Ideas by Business Unit report is a pie chart that displays count of ideas per business unit. This report gives a holistic view of the idea pipeline in an Organization and provides information on number of ideas converted, approved & unapproved per business unit. You can further narrow your search by Idea Status, Ideas Start Date and Is Idea Active?.
  • This is a great way to review demand by type and evaluate where demand is coming from and who will be impacted. Displays a bar graph of all ideas group by type. Provides the ability to drill down into a bar to see which ideas are part of the bar.
  • This is a great way to review demand by type and evaluate where demand is coming from and who will be impacted. Displays a bar graph of all ideas group by type. Provides the ability to drill down into a bar to see which ideas are part of the bar.
  • This is a great way to review demand by type and evaluate where demand is coming from and who will be impacted. Displays a bar graph of all ideas group by type.
  • This is a great way to review demand by type and evaluate where demand is coming from and who will be impacted. Displays a bar graph of all ideas group by type.
  • This is a great way to review demand by type and evaluate where demand is coming from and who will be impacted. Displays a bar graph of all ideas group by type.
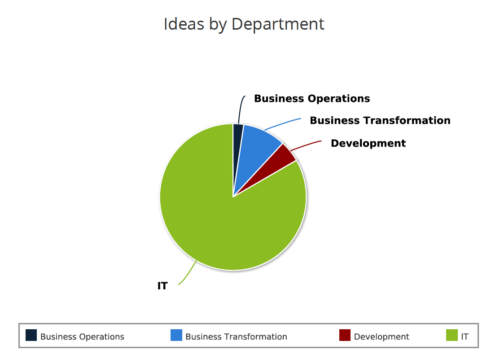
  • Pie Chart displays count of all Ideas by Department.  Filterable by Active and Inactive, by OBS, and by Department Manager.  Data label and mouse-over show department counts.  Legend displays department names.
  • Pie Chart displays count of all Ideas by Department.  Filterable by Active and Inactive, by OBS, and by Department Manager.  Data label and mouse-over show department counts.  Legend displays department names.
  • Pie Chart displays count of all Ideas by Department.  Filterable by Active and Inactive, by OBS, and by Department Manager.  Data label and mouse-over show department counts.  Legend displays department names.
  • Ideas by Department report is a pie chart that displays count of ideas by department. Mouse over on the pie chart displays idea count for that department. You can further narrow your search by OBS Type & Path , Idea Status, Idea Start Date and  Is Idea Active?.
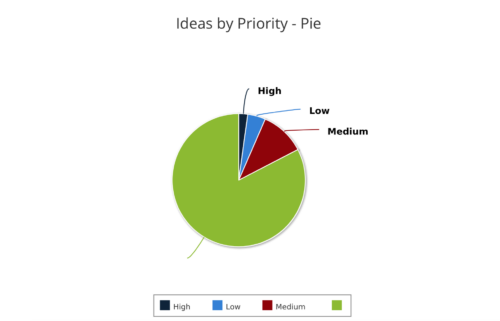
  • Pie Chart displays total Ideas by Priority, filterable by Active / Inactive and by OBS structure.  Data Label and Mouse-over label display counts by Priority.  Legend shows Priority Name.  Chart also shows Ideas with No Priority.
  • Pie Chart displays total Ideas by Priority, filterable by Active / Inactive and by OBS structure.  Data Label and Mouse-over label display counts by Priority.  Legend shows Priority Name.  Chart also shows Ideas with No Priority.
  • Pie Chart displays total Ideas by Priority, filterable by Active / Inactive and by OBS structure.  Data Label and Mouse-over label display counts by Priority.  Legend shows Priority Name.  Chart also shows Ideas with No Priority.
  • Ideas by Priority report is a pie chart that displays ideas count by priority. Mouse over on the pie chart displays idea count for that priority. You can further narrow your search by OBS Type, OBS Path, Idea Status, Idea Start Date and Is Idea Active?
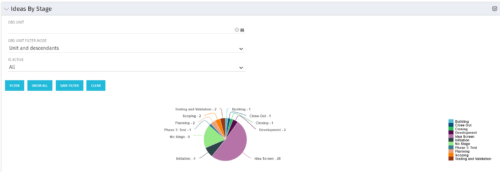
  • Pie Chart displays count of all Ideas by stage.  Filterable by Active and Inactive, and also by OBS.  Data label and mouse-over show Stage counts.  Legend displays Stage names.  This portlet assumes the use of the custom Stage attribute on Idea object.
  • Pie Chart displays count of all Ideas by stage.  Filterable by Active and Inactive, and also by OBS.  Data label and mouse-over show Stage counts.  Legend displays Stage names.  This portlet assumes the use of the custom Stage attribute on Idea object.
  • Pie Chart displays count of all Ideas by stage.  Filterable by Active and Inactive, and also by OBS.  Data label and mouse-over show Stage counts.  Legend displays Stage names.  This portlet assumes the use of the custom Stage attribute on Idea object.
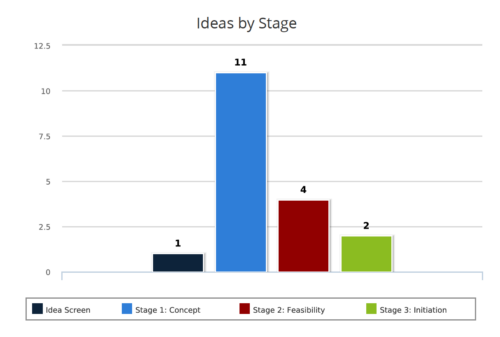
  • Ideas by Stage report is a column chart that displays ideas count by its Stage. Legend displays Stage names. Numerical value on the column bar indicates the idea count for that stage. You can further narrow your search by OBS Type & Path, Idea Status, Idea Start Date and Is Idea Active?
  • Hear what the journey from Project to Product looks like from the trenches. IHG will share tales of what it took to make this transition, some challenges they faced, and what outcomes they have been able to achieve.
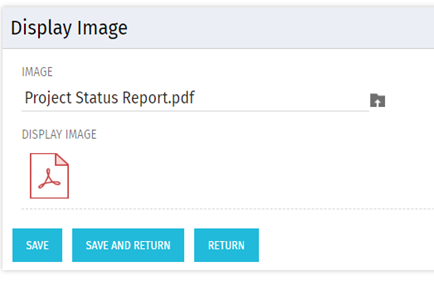
  • There are many times user’s wants to see the preview of file uploaded on attachment attribute.  This Technical Trick will illustrate the steps for an Administrator to preview an attachment. This solution will help to preview PDF, Text file and Image(.png) file. For Microsoft word, PowerPoint and Microsoft Excel, it displays an icon.
  • Effective resource management is vital for delivering successful and profitable projects. Get it right and costs will be controlled, objectives achieved, and deadlines met. Get it wrong and we run the risk of not just project timescales slipping but also margins and competitive advantages eroding. This paper looks at resource management best practices and how we can adopt practices to increase project quality, agility, and efficiency. This White Paper is downloaded from the Rego Consulting site. You will be asked to provide your email address and current ppm tool.  - http://info.regoconsulting.com/smarter-resource-mgmt-whitepaper ** No Download - Do not Add to Cart **
  • Tool adoption can struggle if the user experience is too complex or confusing. In this session, we will explore ways to set up your Apptio space to best suit your user base. Learn how to optimize each user's experience with Apptio through security, customizations, and reporting.
Go to Top