-
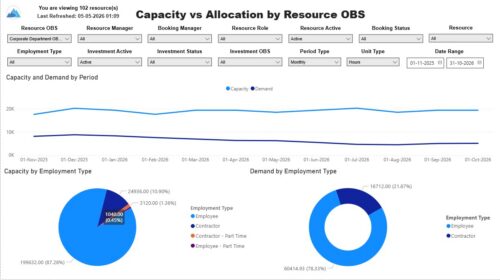 The Capacity vs. Allocation by OBS report displays resource capacity and demand across investments. The report can be grouped by any OBS level, providing visibility into resources at any level of the organization. The report displays amounts by week or month, and in total. The amounts can be displayed as hours or FTEs. Report Prerequisites Verify that you have completed the following prerequisites before you run this report: • Resource capacity amounts display if the resource has availability that is defined and meets the parameter criteria. • Resource demand allocation amounts display if the resource is allocated to at least one investment. Resource assignments are not required. • The Load Data Warehouse job must be run before you run this report. If the Data Warehouse is not populated, the report will not display any data. Also, most of the report parameters do not display options.
 -
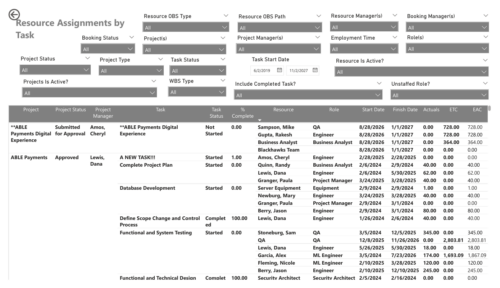 The Resource Assignments by Task report delivers a detailed view of effort distribution for resources working on investment tasks. It outlines both recorded and projected effort at the task assignment level, along with total effort per resource. In addition, the report includes key task details such as progress status, percentage of completion, and assignment start and end dates. This information helps stakeholders monitor workload distribution, track task progress, and evaluate how resource effort aligns with project expectations.
 -
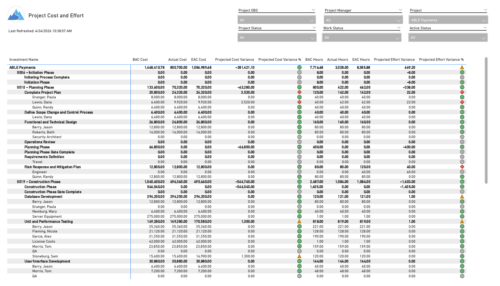 The Project Cost and Effort report provides a structured view of project financials and effort by outlining the work breakdown hierarchy, including any related subprojects. Users can choose to display information at varying levels of detail, such as project, phase, task, or assignment, depending on reporting needs. The report includes key metrics like baseline values, actuals, estimates at completion, and projected variances for both cost and effort. This enables stakeholders to analyze performance, monitor spending and workload, and gain insight into how projects are tracking against expectations.
 -
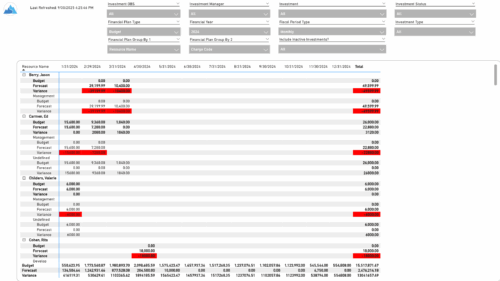
 The Investment Baseline vs. Plan by Task report offers an in-depth view of how resource and role allocations align with original plans. It breaks down key metrics such as baseline, actuals, remaining effort, projected totals, and variances across a rolling 12-month period based on the selected start date. Data is presented both monthly and cumulatively for each investment and assignment, with the flexibility to view values in hours or FTEs. This report helps stakeholders assess performance, identify gaps between planned and actual work, and better understand resource utilization trends.
 -
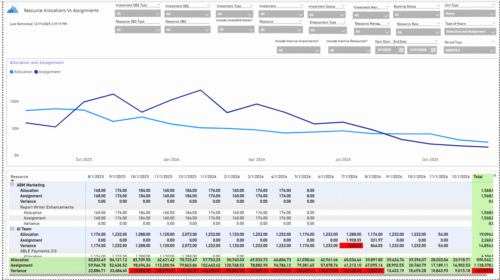 The Allocations and Assignments report displays resource assignments and allocations across multiple projects. This report will provide a single view of the assigned data for all assignments across multiple projects in-line with their allocations. The data is displayed by monthly periods. The horizontal and vertical sums provide a cumulative picture resource wise and month wise respectively. Filters provide the user the ability to monitor data across multiple projects. Filters include investment type, investment, resource, active/inactive resource or investment along with OBS type and OBS unit. If multiple projects are utilizing the same resource, the PM or RM can filter for assignments/allocations utilizing that specific resource to prevent over-allocations or under-allocations.
 -
 The Key Tasks & Milestone Status report delivers comprehensive visibility into task and milestone performance through intuitive Start Date and Finish Date visualizations. It consolidates critical execution details, including task status, WBS type, and associated attributes such as project name, project manager, overall project status, and task completion percentage. The report supports dynamic filtering across multiple dimensions, including projects, OBS path, OBS type, task status, and WBS type, enabling targeted analysis and rapid insight. Interactive dashboards facilitate effective tracking, monitoring, and governance of tasks and milestones across the projects.
 -
 The Investment Issue Register report displays comprehensive information for each investment issue. The report only includes investments where the Risk, Issues, and Change modules are available. Report Prerequisites Verify that you have completed the following prerequisites before you run this report: • The investment must have at least one issue for the project to display in the report. • The issue properties must have fields such as description, category, resolution, target resolution, impact date, and originating ID completed for them to display data in the report. The issue name, issue ID, priority, status, and owner are required in Classic PPM so they always display data. • The Load Data Warehouse job must be run before you run this report. If the Data Warehouse is not populated, the report will not display any data. Also, most of the report parameters do not display options.
 -
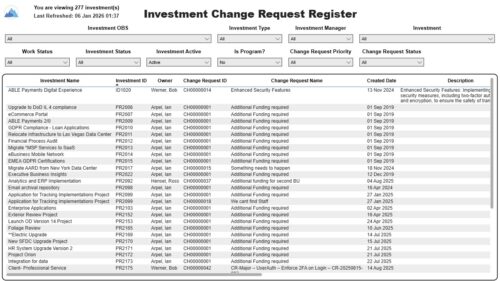 The Investment Change Request Register report displays comprehensive information for each investment change request. The report only includes investments where the Risk, Issues and Change modules are available. Report Prerequisites Verify that you have completed the following prerequisites before you run this report: • The investment must have at least one change request for the project to display in the report. • The change request properties must have fields such as description, change in cost, change in schedule, change in resources, category, expected close, approved by, approved date, and originating ID completed for them to display data in the report. The change request name, change request ID, priority, status, and owner are required in Classic PPM so they always display data. • The Load Data Warehouse job must be run before you run this report. If the Data Warehouse is not populated, the report will not display any data. Also, most of the report parameters do not display options.
 -
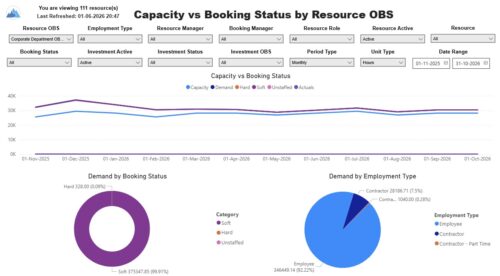 The Capacity vs. Booking Status by OBS report includes three charts. The line chart displays capacity compared to demand, with demand distributed by booking status, and actuals by period. The pie charts display demand by booking status and demand by employment type. The report also includes a detail listing of resource capacity and demand at the booking status level across investments. The report can be grouped by any OBS level, providing visibility into resources at any level of the organization. The report displays amounts by week or month, and in total. The amounts can be displayed as hours or FTEs. Report Prerequisites Verify that you have completed the following prerequisites before you run this report: • Resource capacity amounts display if the resource has availability that is defined and meets the parameter criteria. • Resource demand allocation amounts display if the resource is allocated to at least one investment. Resource assignments are not required. • The Load Data Warehouse job must be run before you run this report. If the Data Warehouse is not populated, the report will not display any data. Also, most of the report parameters do not display options.
 -
 The Resource Time Summary and Detail report provides insight into timesheet hours and notes for each resource across selected time periods. Data can be grouped by resource manager, time period, or any OBS level to support flexible analysis. Interactive visuals allow easy tracking, monitoring, and review of resource time allocation.
 -

 “Rego Health Check” is a UI Friendly, Clarity Studio created add-in that allows environment administrators to create configurations which can be executed on a recurring basis to ensure the environment is running optimally. It allows the Clarity admin to run an Infrastructure Health Check and Status Summary, Application Health Check, and Business-related Checks. This is a RegoLink product that is available for purchase. The download materials provide more information on this product. Contact your Rego Account Director for more information.
 -
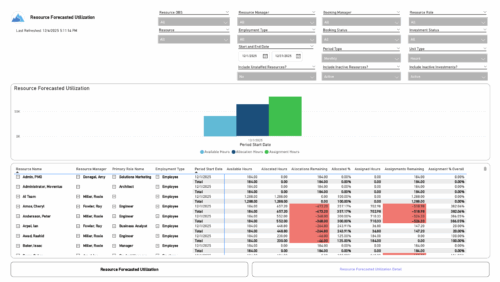 The Resource Forecasted Utilization report provides a high-level view of resource workload by displaying availability, allocation, and assignment amounts over time. Data can be viewed weekly, monthly, or in total, helping teams understand capacity and forecasted demand. Values are shown in either hours or full-time equivalents (FTEs), making it easy to compare utilization across resources and time periods.
 -
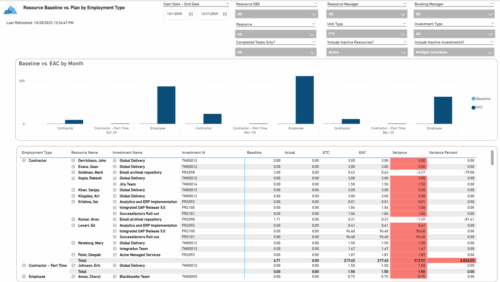 The Resource Baseline vs. Plan by Employment Type report provides insight into how resource utilization compares to the original baseline. It displays baseline, actual, estimate, and variance values for each resource across investments, grouped by employment type—such as employees or contractors. The report includes monthly charts that compare baseline amounts to estimated-at-completion values, with data shown in either hours or full-time equivalents (FTEs). This enables clear visibility into performance and variances by employment category.
 -
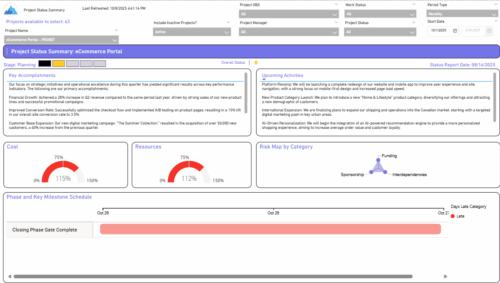 The Project Status Summary report highlights the overall health and progress of a project by summarizing key information such as current stage, status indicators, major accomplishments, upcoming activities, and resource and cost consumption. It also visualizes risk concentration across categories and includes a high-level Gantt chart showing major phases and milestones. This report provides a clear snapshot of project performance for quick executive or stakeholder review.
 -
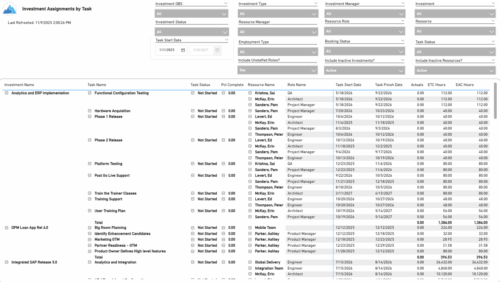 The Investment Assignments by Task report provides a detailed breakdown of effort at the task-assignment level for each investment. It displays both actuals and estimates for resource assignments, along with task status, percent complete, and assignment start and finish dates. Totals are available at the investment level, making it easy to analyze workload, progress, and effort distribution across tasks and resources.
 -
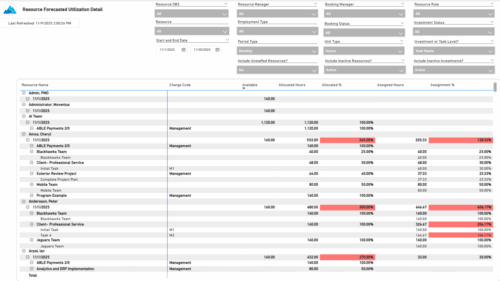 The Resource Forecasted Utilization Detail report provides a detailed view of resource utilization by showing availability, allocation, and assignment values at both the investment and task level. The report is grouped by resource and time period, with data displayed weekly or monthly, as well as in total. Values can be shown in hours or full-time equivalents (FTEs), supporting detailed analysis of workload and forecasted demand.
 -
 The Timesheet Detail report provides a detailed view of timesheet entries for each resource within a selected time period. It includes hours logged against tasks, other work, incidents, and indirect activities, displayed by day and in total. The report also captures any notes associated with each time entry, offering visibility into how time is allocated across different work types.
 -
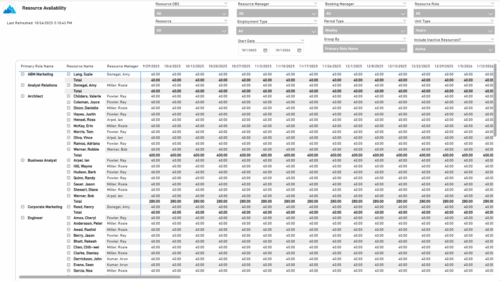 The Resource Availability report provides visibility into each resource’s available capacity across projects. It allows users to view availability by resource, grouped by either resource manager or primary role, helping identify under- or over-utilized team members. The report can display data by week, month, or in total, and amounts can be viewed in hours or full-time equivalents (FTEs).
 -
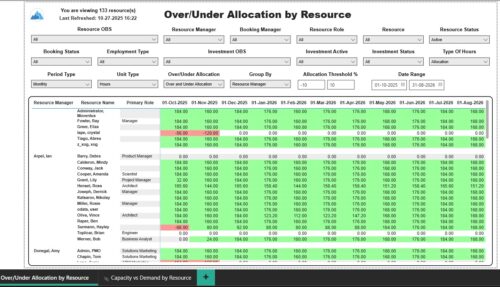 The Over/Under Allocation by Resource report displays resource remaining capacity amounts by resource. The report displays amounts by week or month. The amounts can be displayed as hours or FTEs. This report allows you to drill down to the Capacity vs. Demand by Resource report, by clicking a resource name, to see more information about the resource capacity and demand. Report Prerequisites Verify that you have completed the following prerequisites before you run this report: • The Load Data Warehouse job must be run before you run this report. If the Data Warehouse is not populated, the report will not display any data. Also, most of the report parameters do not display options.
 -
 The Time Compliance Detail report displays the timesheet status by resource, their email, employment type, and resource manager, in their respective OBS.
 -
 The Project Status Detail report provides a comprehensive view of each project’s key elements, including team allocations, major milestones, risks, issues, and change requests. It highlights the most relevant project indicators to give stakeholders a clear understanding of project health and progress. This report supports detailed tracking and review of project performance across multiple dimensions.
 -
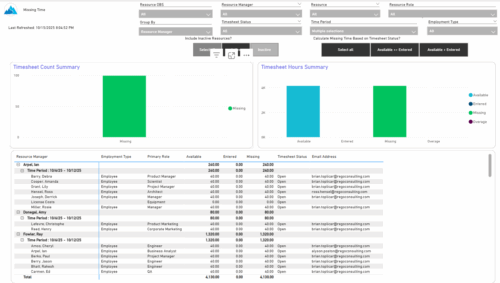 The Missing Time report provides insight into timesheet compliance by comparing available hours, entered hours, and missing hours for each resource over a selected time period. It can be grouped by resource manager or OBS level and offers flexibility to calculate missing time based on timesheet status or resource availability. The report includes summary charts showing timesheet completion rates and total hours, highlighting completed, partial, and missing timesheets as well as overages across reporting periods.
 -
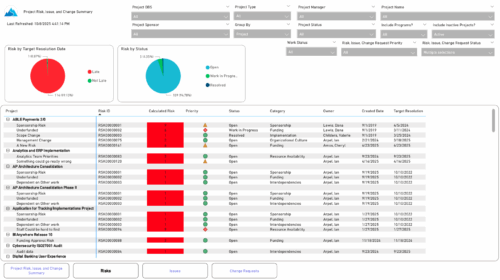 The Project Risk, Issue, and Change Summary report provides an overview of project health by visualizing risks, issues, and change requests. It includes pie charts that display counts by target resolution or expected close date, as well as by status. A detailed table lists each item’s name, ID, priority, status, category, owner, creation date, and resolution or close date. Results can be grouped by project or viewed without grouping to support flexible analysis and tracking.
 -
 The Resource Time Review by Manager report provides visibility into timesheet entries for each resource, organized by investment manager or resource manager. It details hours entered by day and in total for each investment and time entry, helping managers monitor time allocation and utilization across their teams. This report supports effective oversight of resource effort and project participation.
 -
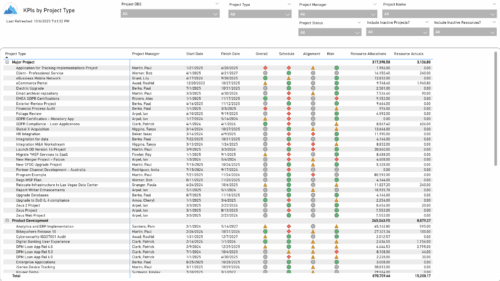 The KPIs by Project Type report provides a consolidated view of key performance indicators across projects, grouped by project type. It highlights metrics such as overall status, schedule, alignment, and risk, along with resource allocation and actual hours tracked since each project’s inception. This report enables quick comparison of performance trends and resource utilization across different project types.
 -
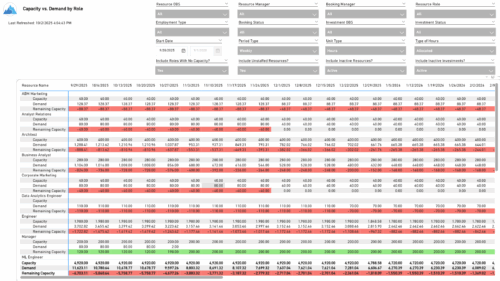 The Capacity vs. Demand by Role report provides visibility into resource utilization by comparing available capacity to actual demand across investments at the role level. It highlights capacity, demand, and remaining capacity, helping identify potential surpluses or shortfalls. Data can be viewed by week or month and displayed in either hours or full-time equivalents (FTEs) to support detailed workforce planning and analysis.
 -
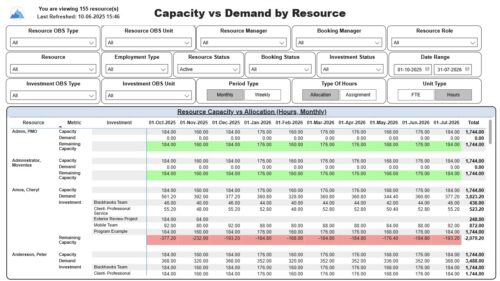 The Capacity vs. Demand by Resource report displays resource capacity and demand at the resource level across investments. The report gives you visibility into the capacity, demand, and remaining capacity by resource. The report displays amounts by week or month, and in total. The amounts might be displayed as hours or FTEs. Report Prerequisites: Verify that you have completed the following prerequisites before you run this report: • The Load Data Warehouse job must be run before you run this report. If the Data Warehouse is not populated, the report will not display any data. Also, most of the report parameters do not display options. • Resource demand allocation amounts display if the resource is allocated to at least one investment and the report display type of hours as allocations. Resource demand assignment amounts display if the resource is assigned to at least one task on the investment and the report displays type of hours as assignments.
 -
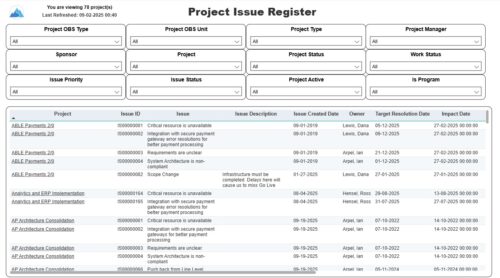 The Project Issue Register report displays comprehensive information for each project issue. The issue register also provides the option to display items that are associated to the issue such as notes, action items, and tasks. Report Prerequisites Verify that you have completed the following prerequisites before you run this report: • The project must have at least one issue for the project to display in the report. • The issue properties must have fields such as description, category, resolution, target resolution, impact date, and originating ID completed for them to display data in the report. The issue name, issue ID, priority, status, and owner are required in Classic PPM so they always display data.
 -
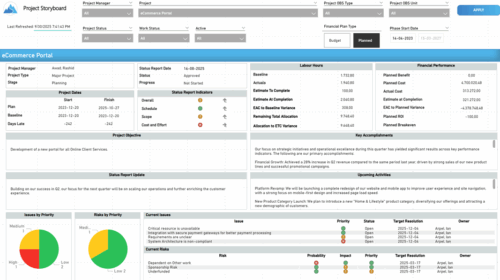 The Time Compliance report displays different frame in the displaying project information such as project dates, project objective, the amount, and cost of resources that are planned and actual, key accomplishments, upcoming activities, current issues and risks, and the project progress toward goals, and some EVM indicators for its phases.
 -
 The Financial Budget vs. Forecast by Period Detail report provides a detailed breakdown of planned or budgeted costs compared to forecasted costs by investment. It displays variances for each period and in total. Users can filter or drill down to view the specific investments that contribute to selected financial plan groupings.
 -
 The Financial Budget vs. Forecast by Period report provides insight into financial performance by comparing planned or budgeted costs against forecasted costs across defined time periods. It highlights period-level and total variances to help identify trends and deviations. Results can be grouped by up to two financial attributes, such as Charge Code, Cost Type, Department, Input Type, Location, Resource, Resource Class, Role, Transaction Class, or User Values 1 and 2, allowing flexible analysis by key dimensions.
 -
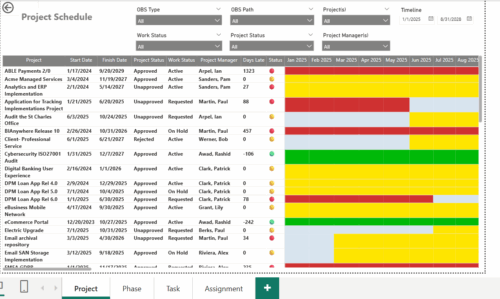 The Project Schedule report provides visibility into project schedule, including detailed information on days late, status and its associated items such as detailed info of schedule on Phase level, Task level and assignment level. Results are grouped by project in Phase, Task and assignment sections or can be viewed without grouping to support flexible analysis for projects. Interactive visuals make it easy to track, monitor, and manage schedule across projects.
 -
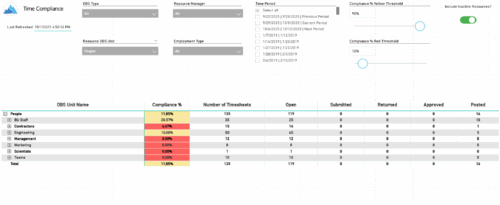 The Time Compliance report displays the timesheet compliance percent, the number of timesheets by status (open, submitted, returned, approved, and posted), and the total for each OBS unit, with the ability to filter and drill down.
 -
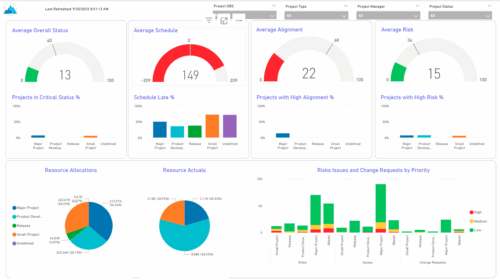 The KPIs by Project Type (Dashboard) report provides visibility into key project health measures, including status, schedule, alignment, and risk. Gauge visuals highlight each KPI at a summary level, while column charts break down results by project type. Resource allocation and actual hours are summarized in pie charts, making it easy to compare utilization across project types. In addition, bar charts display the number of issues, risks, and change requests by project type and priority, helping teams quickly identify areas of concern.
 -
 Join us for a round table discussion on advanced SQL. We'll discuss sub-queries, common table expressions (CTE's), analytic functions, and any other requested topics. With multiple instructors we can break out into smaller groups for a more targeted experience.
 -
 Join us to discuss one of the most important - but also one of the most confusing Clarity topics - security. Learn how an OBS can be utilized to control security, how security permissions can be granted and revoked, and the pros and cons of the different types of security permissions.


Copyright 2023 • Rego Consulting Corporation • Privacy Policy