-
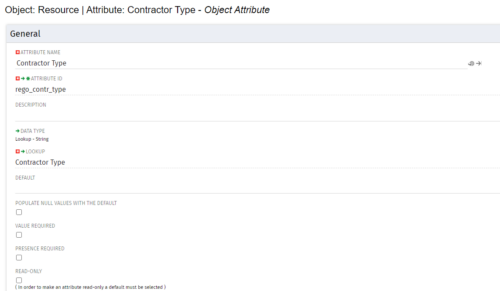
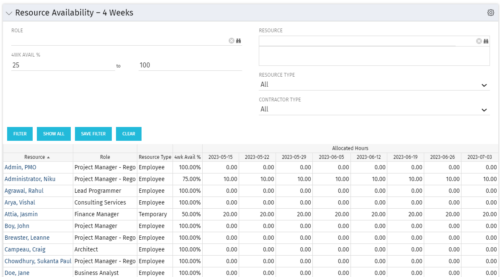 Resource Availability – 4 Weeks is a grid portlet that displays all resources with their total allocated hours by week, and an average availability percent (4 Wk Avail %) for next four weeks. If % Available is negative, this indicates an over-allocation. Zero% Average Availability indicates fully allocated (no remaining availability). Filterable by Role, Resource, Resource Type, Full-Time/Part-Time, Availability Range. Contractor Type is a custom attribute (Lookup - String) created on the Resource object. It is attached to the lookup, Contractor Type (Lookup ID: REGO_CONTRACTOR_TYPE) that has static values Part Time (PT) and Full Time(FT).
 -
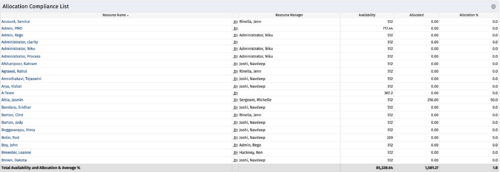
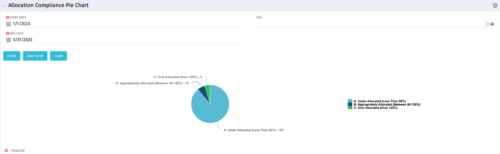
This Allocation Compliance Drilldown Enhancement portlet is used in conjunction with the Allocation Compliance Pie Chart. Once the user selects a specific section of the chart, the Allocation Compliance Drilldown Enhancement will display a list of resources fulfilling that selection. The Allocation Compliance list portlet shows the Resource Name, the Resource Manager, Availability, Allocated Hours and Allocation % for the selection. Note: The Allocation compliance pie chart is displayed first based on the filter selection i.e., Start Date, End Date and OBS. The pie chart is displayed as per the following three slices of the pie: Under Allocated (Less than 80%) Appropriately Allocated (Between 80-120%) Over Allocated (Above 120%) The slice of a pie can be clicked to display resource allocation compliance information in the Allocation Compliance List portlet, as described earlier. The table below describes the available columns in the Allocation Compliance list portlet. The first 5 are configured in the default view: Column Label Description Resource Name Name of the Resource Resource Manager Resource Manager Availability Resource Availability Allocated Resource Allocation Allocation % Resource Allocation % Res_id Unique identifier of the Resource -
This Allocation Compliance Drilldown Enhancement portlet is used in conjunction with the Allocation Compliance Pie Chart. Once the user selects a specific section of the chart, the Allocation Compliance Drilldown Enhancement will display a list of resources fulfilling that selection. The Allocation Compliance list portlet shows the Resource Name, the Resource Manager, Availability, Allocated Hours and Allocation % for the selection. Note: The Allocation compliance pie chart is displayed first based on the filter selection i.e., Start Date, End Date and OBS. The pie chart is displayed as per the following three slices of the pie: Under Allocated (Less than 80%) Appropriately Allocated (Between 80-120%) Over Allocated (Above 120%) The slice of a pie can be clicked to display resource allocation compliance information in the Allocation Compliance List portlet, as described earlier. The table below describes the available columns in the Allocation Compliance list portlet. The first 5 are configured in the default view: Column Label Description Resource Name Name of the Resource Resource Manager Resource Manager Availability Resource Availability Allocated Resource Allocation Allocation % Resource Allocation % Res_id Unique identifier of the Resource -
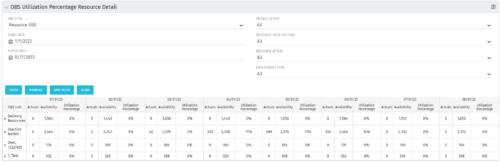
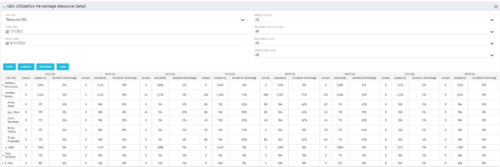 This portlet depicts the Resource Utilization by comparing actual hours booked as a percentage of total resource availability grouped and totaled by OBS Unit in a hierarchical fashion. Resource availability is determined by the working days and daily availability on the individual Resource Calendar and is depicted on a Monthly basis. This portlet uses Monthly Times and the Time Slice job may need to run before the end user will see results in the portlet. The portlet filters for Project Activity, Resource Open for Time, Resource Activity, and Employment time have been added to OBS Type and the Start and Finish dates. The OBS summary totals show on a single line, but can be clicked (+) to roll out the details behind each OBS total.
 -
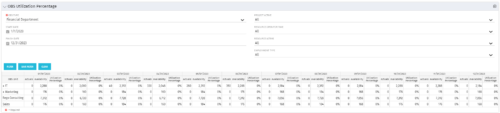 This view depicts the Resource Utilization by comparing actual hours booked as a percentage of total resource availability grouped and totaled by OBS Unit in a hierarchical fashion. Resource availability is determined by the working days and daily availability on the individual Resource Calendar and is depicted on a Monthly basis. This portlet uses Monthly Times and the Time Slice job may need to run before the end user will see results in the portlet. The portlet filters for Project Activity, Resource Open for Time, Resource Activity, and Employment time have been added to OBS Type and the Start and Finish dates.
 -
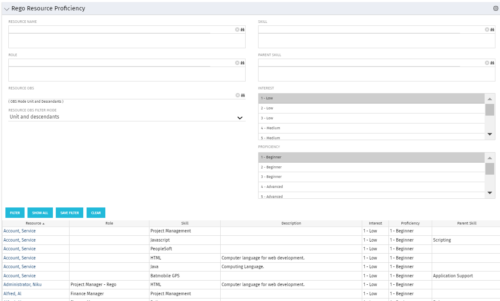 This grid displays Skill Proficiency and Interest Level by Resource. Users can utilize this view to search for Resources by Skill, Parent Skill, Interest, Role, Parent Role, Resource and Resource OBS. This portlet grants a Project Manager or Resource Manager the ability to determine which Resources best fit the needs for their project.
 -
This grid displays Skill Proficiency and Interest Level by Resource. Users can utilize this view to search for Resources by Skill, Parent Skill, Interest, Role, Parent Role, Resource and Resource OBS. This portlet grants a Project Manager or Resource Manager the ability to determine which Resources best fit the needs for their project.
-
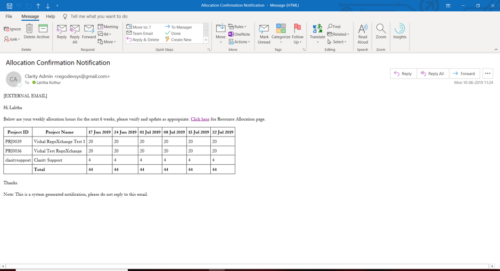 A Process run via Execute a Process job; sends an email to active resources, containing a facsimile of their Resource Allocation Detail page. It shows the next six weeks of allocations by investment, with a column total. The email also contains a click here link to this page in CA PPM, to enable editing of the data, as appropriate.
 -
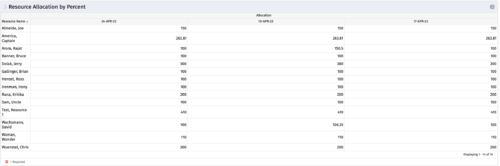 This portlet shows resource allocation by percent and hours, and gives ability to filter on allocation percent. The RM can use the portlet to see if any of the resources is over/ under allocated.
 -
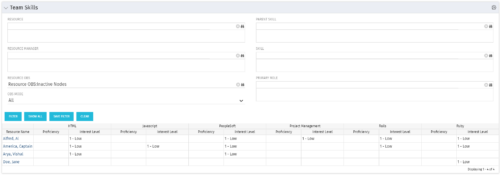 The Team Skills portlet displays Skill Proficiency and Interest Level by Resource. Users can utilize this view to search for Resources by Skill, Parent Skill, Interest, Role, Parent Role, Resource and Resource OBS. This portlet grants a Project Manager or Resource Manager the ability to determine which Resources best fit the needs for their project.
 -
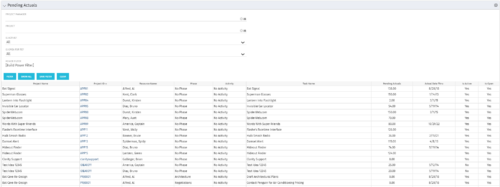 The Pending Actuals portlet displays pending actuals for resources by task. This portlet allows the user to filter on Project, Project Manager, Is Active and Is Open for Time Entry. This portlet provides Resource Managers and Project Managers a simple way to analyse which actuals have been submitted but not posted on specific tasks, as well as the aggregate pending hour total. Note: the information displayed is dependent on what the user has security rights to view.
 -
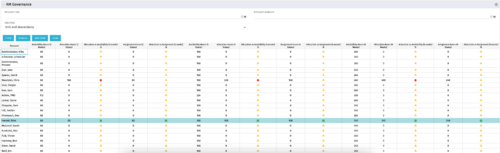 The RM Governance portlet provides resource availability, allocation, and comparison of the two values at 2, 4, and 8-week intervals. Allows searching on any RM or resource OBS instead of pre-filtering for the logged in user.
 -
 The My Resource Vacation portlet allows a resource to view the current logged in users' annual vacation allowance, as set by the resource manager, against the resource vacation calendar hours and actual posted timesheet hours. The portlet is useful for determining the amount of hours a resource has requested off and has remaining. The portlet also ensures the resource has accounted for all annual vacation allowance hours in the calendar and has posted time for all past calendar request hours.
 -
The My Resource Vacation portlet allows a resource to view the current logged in users' annual vacation allowance, as set by the resource manager, against the resource vacation calendar hours and actual posted timesheet hours. The portlet is useful for determining the amount of hours a resource has requested off and has remaining. The portlet also ensures the resource has accounted for all annual vacation allowance hours in the calendar and has posted time for all past calendar request hours.
-
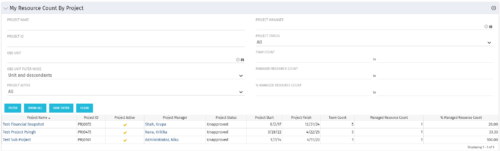 The My Resource Count by Project portlet displays project information, total team count and the current user’s resource count assigned to each project. The user may narrow the results by filtering on project name, manager, status, team count, managed resource count or percentage managed resource count. Using this portlet, resource managers can quickly identify which projects their resources are allocated to without having to navigate to each resource individually. Not only does this portlet display the overall team count on the project (team count), but it also displays the managed resource count (logged in user’s number of resources allocated to the project) as well as the percentage of managed resource count to team count.
 -
The My Resource Count by Project portlet displays project information, total team count and the current user’s resource count assigned to each project. The user may narrow the results by filtering on project name, manager, status, team count, managed resource count or percentage managed resource count. Using this portlet, resource managers can quickly identify which projects their resources are allocated to without having to navigate to each resource individually. Not only does this portlet display the overall team count on the project (team count), but it also displays the managed resource count (logged in user’s number of resources allocated to the project) as well as the percentage of managed resource count to team count.
-
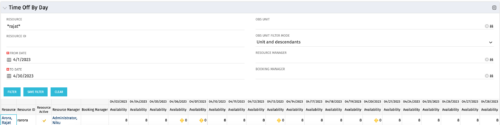 The Time Off by Day portlet displays resource availability by day. The portlet results may be filtered on: Resource Manager, Booking Manager, Resource, OBS Unit, and Date Range. This portlet will display the availability for each resource by day in separate columns and obtains the information from the time slices. When the portlet encounters an exception day (personal day off, or holiday on the base calendar), a yellow caution icon will appear within the same cell. Using this portlet, resource managers are able to quickly determine availability for their resources over a set time range.
 -
The Time Off by Day portlet displays resource availability by day. The portlet results may be filtered on: Resource Manager, Booking Manager, Resource, OBS Unit, and Date Range. This portlet will display the availability for each resource by day in separate columns and obtains the information from the time slices. When the portlet encounters an exception day (personal day off, or holiday on the base calendar), a yellow caution icon will appear within the same cell. Using this portlet, resource managers are able to quickly determine availability for their resources over a set time range.
-
 The Dashboard: Project Status Single-line portlet gives an overview of the project overall status as well as the status indicators on the "current" status report object. The portlet will pull the "id" from the page it is placed on, so this portlet is usually placed on the project dashboard tab. This portlet displays the report date, symbols relating to the overall status, scope, schedule, cost/effort, and the overall explanation across a single line in the portlet.
 -
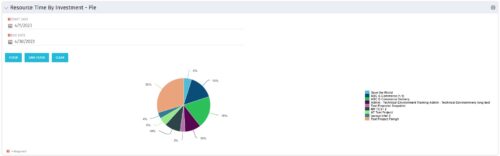 The Resource Time by Investment - Pie portlet shows a graphical representation of the time spent on investments for all resources where the logged in user is selected as the resource manager. The portlet gives the Resource Manager the ability to quickly view all time reported by resources against projects. The portlet filters between specific dates using the daily actuals timeslice. The pie chart provides a graphical view as to how time is divided across projects.
 -
The Resource Time by Investment - Pie portlet shows a graphical representation of the time spent on investments for all resources where the logged in user is selected as the resource manager. The portlet gives the Resource Manager the ability to quickly view all time reported by resources against projects. The portlet filters between specific dates using the daily actuals timeslice. The pie chart provides a graphical view as to how time is divided across projects.
-
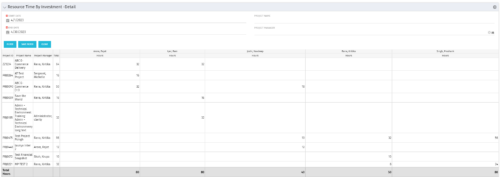 The Resource Time by Investment Detail portlet gives the Resource Manager the ability to search for time reported by resources against investments. The portlet provides filters for specific dates, a particular project and/or Project Manager. Using this portlet, the RM can get an overview of all data in a time period, the overall time logged to a project and the breakdown of his or her resources’ hours on that project.
 -
The Resource Time by Investment Detail portlet gives the Resource Manager the ability to search for time reported by resources against investments. The portlet provides filters for specific dates, a particular project and/or Project Manager. Using this portlet, the RM can get an overview of all data in a time period, the overall time logged to a project and the breakdown of his or her resources’ hours on that project.
-
 The Dashboard: Open Risks portlet gives an overview of all risks that are not closed or resolved for a single project. The portlet will pull the "id" from the page it is placed on, so this portlet is usually placed on the project dashboard tab. The portlet sorts the risks first by priority and then by target date. It displays the name, owner, target date, probability impact, and priority.
 -
 The Dashboard: Open Milestones portlet gives an overview of all milestones that are started or not started for a single project. The portlet will pull the "id" from the page it is placed on, so this portlet is usually placed on the project dashboard tab. The milestones are sorted by Due Date. It displays the name, Due Date, Baseline Date, Days Late (Due Date – Baseline Date), and Days Old (Current Date – Due Date).
 -
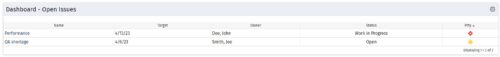 The Dashboard: Open Issues portlet gives an overview of all issues that are not closed or resolved for a single project. The portlet will pull the "id" from the page it is placed on, so this portlet is usually placed on the project dashboard tab. The portlet sorts the issues first by priority and then by target date. It displays the name, target date, owner, status and priority.
 -
The Dashboard: Open Issues portlet gives an overview of all issues that are not closed or resolved for a single project. The portlet will pull the "id" from the page it is placed on, so this portlet is usually placed on the project dashboard tab. The portlet sorts the issues first by priority and then by target date. It displays the name, target date, owner, status and priority.
-
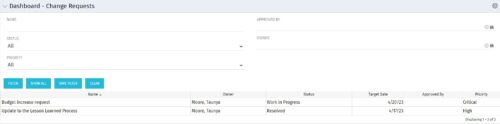 The Dashboard: Change Requests portlet gives an overview of all change requests on the project. The portlet will pull the "id" from the page it is placed on, so this portlet is usually placed on the project dashboard tab. The portlet sorts the issues first by priority and then by target date. It displays the name, owner, status, target date, approved by, and the priority.
 -
 This training document is a Rego Consulting Quick Reference Guide to assist in the replacement of roles with named resources in Clarity’s Modern User Experience. This doc references version 16.1 views. Document provides detail on soft bookings, default allocation and requested manager. Instructions are provided on how to access requests from the Staffing Plan view and how to swap the role for a named resource. If requests are not fulfilled in their entirety, details are provided on how the excess allocation is handled.
 -
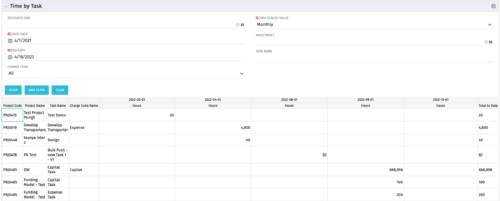 The Time by Task portlet displays time logged to tasks for all investments the logged in user has security rights to view - pulling data from the timeslices. It is capable of displaying the data by weekly, monthly, quarterly or annually segments. The portlet may also be filtered by investment and resource OBS.
 -
The Time by Task portlet displays time logged to tasks for all investments the logged in user has security rights to view - pulling data from the timeslices. It is capable of displaying the data by weekly, monthly, quarterly or annually segments. The portlet may also be filtered by investment and resource OBS.
-
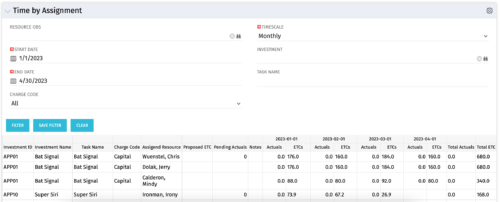 The Time by Assignment portlet displays time logged to assignments for all investments the logged in user has security rights to view - pulling data from the timeslices. It is capable of displaying the data by weekly, monthly or quarterly segments. The portlet may also be filtered by investment and resource OBS.
 -
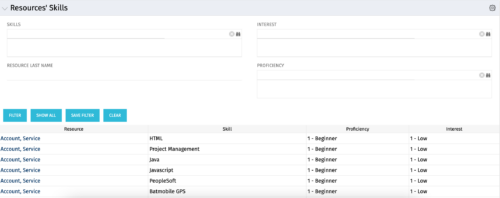 The Resources’ Skills portlet displays all resources, skills, proficiencies, and interests. Using this portlet, resource managers can quickly assess all skills within the system for their resources. The portlet results may be filtered on: Skill, Resource Last Name, Interest and Proficiency.


Copyright 2023 • Rego Consulting Corporation • Privacy Policy