-
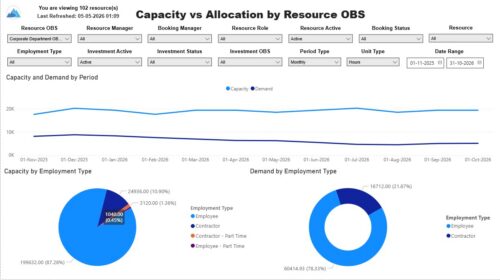 The Capacity vs. Allocation by OBS report displays resource capacity and demand across investments. The report can be grouped by any OBS level, providing visibility into resources at any level of the organization. The report displays amounts by week or month, and in total. The amounts can be displayed as hours or FTEs. Report Prerequisites Verify that you have completed the following prerequisites before you run this report: • Resource capacity amounts display if the resource has availability that is defined and meets the parameter criteria. • Resource demand allocation amounts display if the resource is allocated to at least one investment. Resource assignments are not required. • The Load Data Warehouse job must be run before you run this report. If the Data Warehouse is not populated, the report will not display any data. Also, most of the report parameters do not display options.
 -
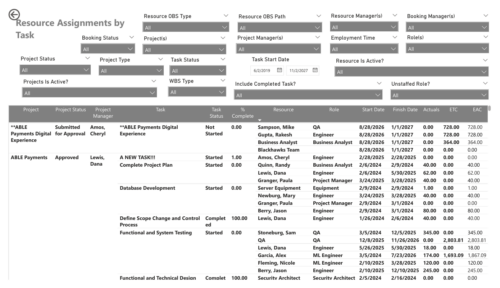 The Resource Assignments by Task report delivers a detailed view of effort distribution for resources working on investment tasks. It outlines both recorded and projected effort at the task assignment level, along with total effort per resource. In addition, the report includes key task details such as progress status, percentage of completion, and assignment start and end dates. This information helps stakeholders monitor workload distribution, track task progress, and evaluate how resource effort aligns with project expectations.
 -
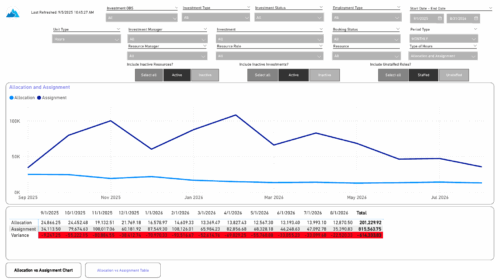
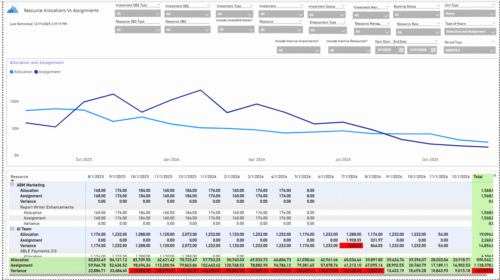 The Allocations and Assignments report displays resource assignments and allocations across multiple projects. This report will provide a single view of the assigned data for all assignments across multiple projects in-line with their allocations. The data is displayed by monthly periods. The horizontal and vertical sums provide a cumulative picture resource wise and month wise respectively. Filters provide the user the ability to monitor data across multiple projects. Filters include investment type, investment, resource, active/inactive resource or investment along with OBS type and OBS unit. If multiple projects are utilizing the same resource, the PM or RM can filter for assignments/allocations utilizing that specific resource to prevent over-allocations or under-allocations.
 -
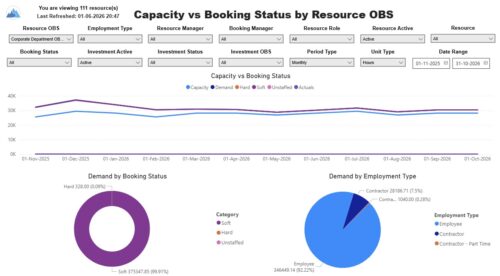 The Capacity vs. Booking Status by OBS report includes three charts. The line chart displays capacity compared to demand, with demand distributed by booking status, and actuals by period. The pie charts display demand by booking status and demand by employment type. The report also includes a detail listing of resource capacity and demand at the booking status level across investments. The report can be grouped by any OBS level, providing visibility into resources at any level of the organization. The report displays amounts by week or month, and in total. The amounts can be displayed as hours or FTEs. Report Prerequisites Verify that you have completed the following prerequisites before you run this report: • Resource capacity amounts display if the resource has availability that is defined and meets the parameter criteria. • Resource demand allocation amounts display if the resource is allocated to at least one investment. Resource assignments are not required. • The Load Data Warehouse job must be run before you run this report. If the Data Warehouse is not populated, the report will not display any data. Also, most of the report parameters do not display options.
 -
 The Resource Time Summary and Detail report provides insight into timesheet hours and notes for each resource across selected time periods. Data can be grouped by resource manager, time period, or any OBS level to support flexible analysis. Interactive visuals allow easy tracking, monitoring, and review of resource time allocation.
 -
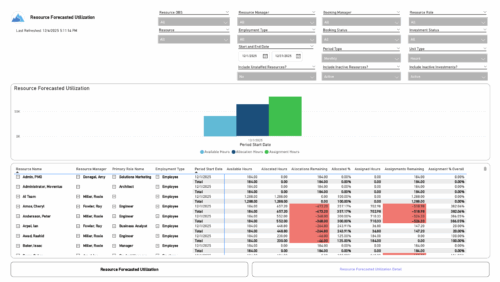 The Resource Forecasted Utilization report provides a high-level view of resource workload by displaying availability, allocation, and assignment amounts over time. Data can be viewed weekly, monthly, or in total, helping teams understand capacity and forecasted demand. Values are shown in either hours or full-time equivalents (FTEs), making it easy to compare utilization across resources and time periods.
 -
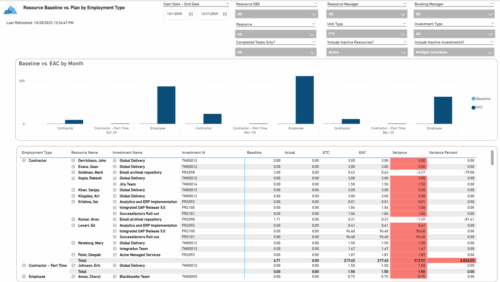 The Resource Baseline vs. Plan by Employment Type report provides insight into how resource utilization compares to the original baseline. It displays baseline, actual, estimate, and variance values for each resource across investments, grouped by employment type—such as employees or contractors. The report includes monthly charts that compare baseline amounts to estimated-at-completion values, with data shown in either hours or full-time equivalents (FTEs). This enables clear visibility into performance and variances by employment category.
 -
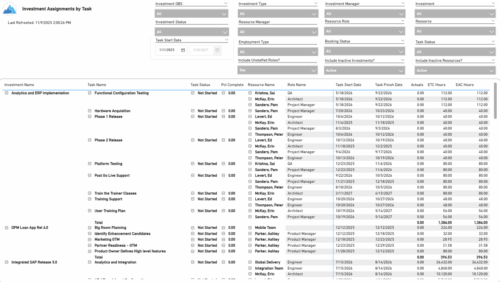 The Investment Assignments by Task report provides a detailed breakdown of effort at the task-assignment level for each investment. It displays both actuals and estimates for resource assignments, along with task status, percent complete, and assignment start and finish dates. Totals are available at the investment level, making it easy to analyze workload, progress, and effort distribution across tasks and resources.
 -
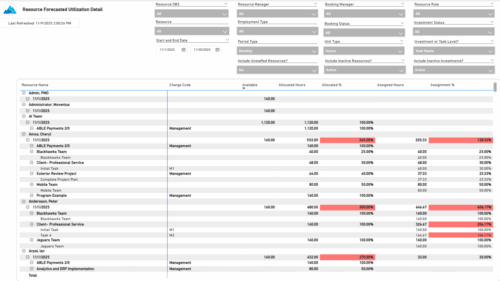 The Resource Forecasted Utilization Detail report provides a detailed view of resource utilization by showing availability, allocation, and assignment values at both the investment and task level. The report is grouped by resource and time period, with data displayed weekly or monthly, as well as in total. Values can be shown in hours or full-time equivalents (FTEs), supporting detailed analysis of workload and forecasted demand.
 -
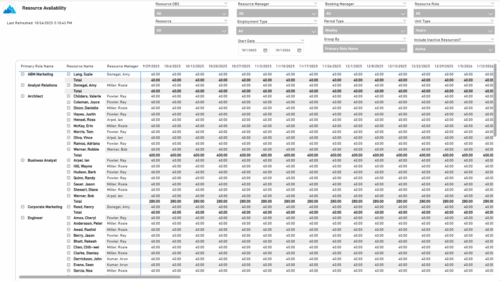 The Resource Availability report provides visibility into each resource’s available capacity across projects. It allows users to view availability by resource, grouped by either resource manager or primary role, helping identify under- or over-utilized team members. The report can display data by week, month, or in total, and amounts can be viewed in hours or full-time equivalents (FTEs).
 -
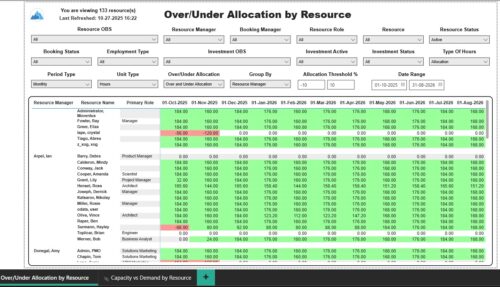 The Over/Under Allocation by Resource report displays resource remaining capacity amounts by resource. The report displays amounts by week or month. The amounts can be displayed as hours or FTEs. This report allows you to drill down to the Capacity vs. Demand by Resource report, by clicking a resource name, to see more information about the resource capacity and demand. Report Prerequisites Verify that you have completed the following prerequisites before you run this report: • The Load Data Warehouse job must be run before you run this report. If the Data Warehouse is not populated, the report will not display any data. Also, most of the report parameters do not display options.
 -
 The Resource Time Review by Manager report provides visibility into timesheet entries for each resource, organized by investment manager or resource manager. It details hours entered by day and in total for each investment and time entry, helping managers monitor time allocation and utilization across their teams. This report supports effective oversight of resource effort and project participation.
 -
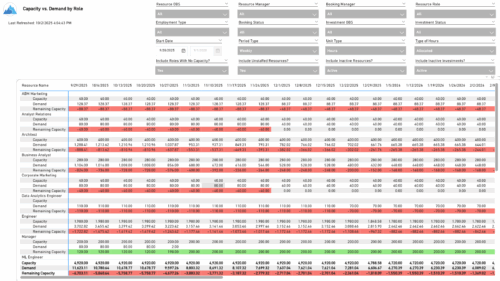 The Capacity vs. Demand by Role report provides visibility into resource utilization by comparing available capacity to actual demand across investments at the role level. It highlights capacity, demand, and remaining capacity, helping identify potential surpluses or shortfalls. Data can be viewed by week or month and displayed in either hours or full-time equivalents (FTEs) to support detailed workforce planning and analysis.
 -
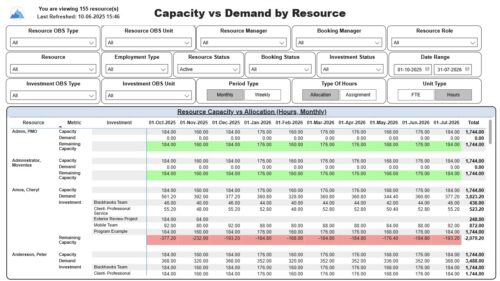 The Capacity vs. Demand by Resource report displays resource capacity and demand at the resource level across investments. The report gives you visibility into the capacity, demand, and remaining capacity by resource. The report displays amounts by week or month, and in total. The amounts might be displayed as hours or FTEs. Report Prerequisites: Verify that you have completed the following prerequisites before you run this report: • The Load Data Warehouse job must be run before you run this report. If the Data Warehouse is not populated, the report will not display any data. Also, most of the report parameters do not display options. • Resource demand allocation amounts display if the resource is allocated to at least one investment and the report display type of hours as allocations. Resource demand assignment amounts display if the resource is assigned to at least one task on the investment and the report displays type of hours as assignments.
 -
 Take your Resource Planning to the next level with itDesign’s Advanced Resource Planning add-on for Clarity.
 -
 Does your organization struggle with resource management? Have you considered creating a Resource Management Office (RMO)? Do you struggle with a lack of executive sponsorship to drive adoption? This session will review how some organizations are succeeding in driving adoption and effectively managing resources by engaging leadership, RMOs, and utilizing more dedicated resources. Learn best practices for driving effective resource management across your organization.
 -
 Do you want to talk to other Clarity customers that are using - or plan to use - resource management capabilities? In this moderated Round Table, attendees can share experiences and provide insights on process, configurations, challenges, and successes. We will have an expert panel and then divide into small groups to discuss customer selected topics. 100% sharing. 100% learning.
 -
 The Rego PowerBI Reporting Suite features close to 100 free PowerBI reports, designed to enhance project management and reporting capabilities.
 -
 This session will align you with best practices for using Clarity's resource management functionality. Come and learn about the OOTB capabilities for resource insights like allocations, assignments, availability, and more. Additionally, tips and tricks will be shared, providing you with a toolkit of ideas for your organization!
 -
 Bringing back a classic topic with a modern update! Join this session to discuss tips and tricks for an optimized resource manager experience in Clarity. This session is designed so attendees can share, collaborate, and benefit from their diverse experiences.
 -
 The Investment Allocations and Assignments report provides visibility into team member allocation, task assignment, and variance amounts by investment across time periods. A chart highlights allocation compared to assignment amounts by period. Results can be displayed by week, month, or in total, and viewed in either hours or FTEs for each team member and investment. Interactive visuals make it easy to compare planned effort against actual assignments at the team member and investment level. Content Type: Business Intelligence, PowerBI Report
 -
 This training document is a Rego Consulting Quick Reference Guide to assist with Staff Grid in Clarity’s Modern User Experience. This doc references version 16.3 views. Document provides detail on the use of the Staff Grid in the Staffing Modules in the Common Component functionality.
 -
This training document is a Rego Consulting Quick Reference Guide to assist with utilization of the Staffing page in Clarity’s Modern User Experience. This doc references version 16.3 views. Document provides detail on the layout and capabilities of the Staff Grid as well as the Allocations Timeline. Information is provided on columns, widgets and filtering. Instructions are provided on how to save Views. Summary information is provided on the layout of the Allocation Timeline and includes detail on the Investment Timeline and the Resource Histogram. Investment Timeline summary contains information on the Allocations by Investments and the Allocations by Resources tabs. While the Resource Histogram section provides screenshots on Resource Availability and Resources by Role.
-
This training document is a Rego Consulting Quick Reference Guide to assist with Allocations Timeline in Clarity’s Modern User Experience. This doc reviews the Investment Timeline and the Resource Histogram sections of the Allocations Timeline.
-
 This training document is a Rego Consulting Quick Reference Guide to assist with the Resources Workspace in Clarity’s Modern User Experience. This doc references version 16.3 views. Document reviews the Resources, Roles and Teams tabs in the Resources Workspace.
 -
This training document is a Rego Consulting Quick Reference Guide to assist in the replacement of roles with named resources in Clarity’s Modern User Experience. This doc references version 16.3 views. Document provides detail on soft bookings, default allocation and requested manager. Instructions are provided on how to access requests from the Staffing Plan view and how to swap the role for a named resource. If requests are not fulfilled in their entirety, details are provided on how the excess allocation is handled.
-
This training document is a Rego Consulting Quick Reference Guide to assist with creation and management of resource Teams in Clarity’s Modern User Experience. This doc references version 16.3 views. Document provides detail on how to create Teams and add resources to a Team. Instructions are provided on how to add resources by OBS and how to allocate a team to an investment. Team key points are provided with regard to Classic, Allocations, ETC and Financials.
-
This training document is a Rego Consulting Quick Reference Guide to assist with the staffing of a Team on an investment in Clarity’s Modern User Experience. This doc references version 16.3 views. Doc covers Common Terms, setting up a Default Allocation, Allocation vs ETC, Staff Tab, and Staffing the Team – Time Scale.
-
 This training document is a Rego Consulting Quick Reference Guide to assist with the adding of resources to the Staff tab for Ideas in Clarity’s Modern User Experience. This doc references version 16.3 views. Document provides detail on how to add resources to the Staff tab, Default Allocation % and Per-Period metrics.
 -
 To effectively practice Agile at scale, Clarity teams first need to identify various needs. This includes thinking through considerations for funding, investment prioritization, and spend management practices.
 -
 Today's workforce is more diverse than ever, and a "one size fits all" approach to leadership is seldom effective. A remote/hybrid workforce presents unique challenges, and teams often represent many different generations each with unique characteristics and needs. Even if you are not in a formal leadership position, we all are responsible for reflecting leadership skills and traits that encourage a collaborative spirit where everyone can bring the best version of themselves to their efforts. We'll offer some insights and opportunities that will help you and your teams to thrive.
 -
 You can’t wait, integrate! Clarity is highly capable of being the center of a hub and spoke ecosystem for your project delivery. With flexible integration options and robust portfolio reporting and decision support functionality, Clarity will help you consolidate data from multiple systems of record into one source of truth. Join this class to see common use cases for optimizing a PPM delivery value stream that cuts across a diverse suite of applications, including HR, Finance, ITSM, Agile, Work Management, and many more.
 -
 Does your organization struggle with resource management? Have you considered creating a Resource Management Office (RMO)? Do you struggle with a lack of executive sponsorship to drive adoption? This session will review how some organizations are succeeding in driving adoption and effectively manage resources through engaging leadership, RMOs, and using more dedicated resources. Learn about some best practices for driving effective resource management across your organization.
 -
 A presentation slide deck from RegoU 2024. This course focused on an itDesign product that adds-on to Clarity for Resource Management enhancement.
 -
 Wabtec shares how they utilized Clarity and Power BI to build an enhanced Resource Management monitoring solution.
 -
 This session will align you with some of the best and most common practices for using Clarity's Resource Management capabilities. Come and learn about the capabilities that come out of the box for resource insights like allocations, assignments, availability and more. Additionally, tips and tricks will be discussed leaving you with a toolkit of ideas for your organization!


Copyright 2023 • Rego Consulting Corporation • Privacy Policy