-
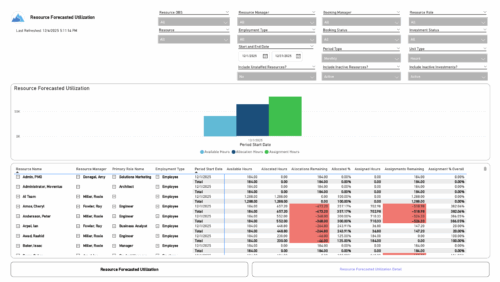 The Resource Forecasted Utilization report provides a high-level view of resource workload by displaying availability, allocation, and assignment amounts over time. Data can be viewed weekly, monthly, or in total, helping teams understand capacity and forecasted demand. Values are shown in either hours or full-time equivalents (FTEs), making it easy to compare utilization across resources and time periods.
 -
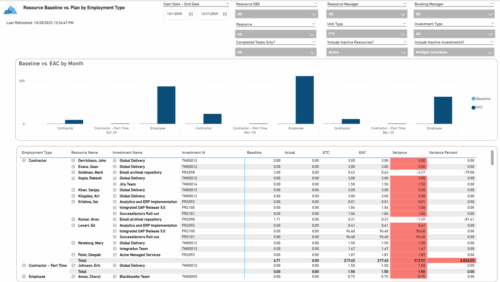 The Resource Baseline vs. Plan by Employment Type report provides insight into how resource utilization compares to the original baseline. It displays baseline, actual, estimate, and variance values for each resource across investments, grouped by employment type—such as employees or contractors. The report includes monthly charts that compare baseline amounts to estimated-at-completion values, with data shown in either hours or full-time equivalents (FTEs). This enables clear visibility into performance and variances by employment category.
 -
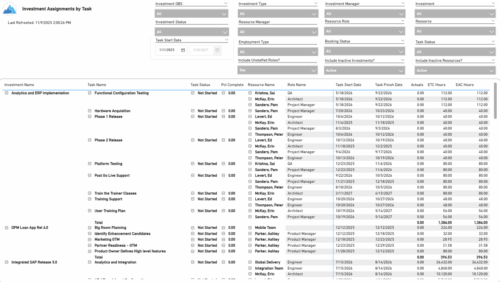 The Investment Assignments by Task report provides a detailed breakdown of effort at the task-assignment level for each investment. It displays both actuals and estimates for resource assignments, along with task status, percent complete, and assignment start and finish dates. Totals are available at the investment level, making it easy to analyze workload, progress, and effort distribution across tasks and resources.
 -
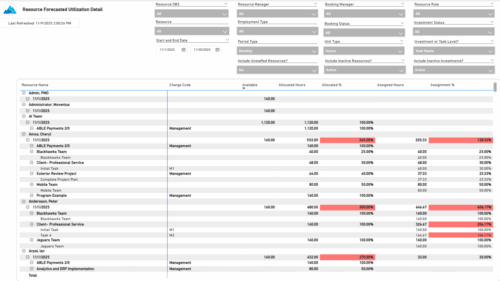 The Resource Forecasted Utilization Detail report provides a detailed view of resource utilization by showing availability, allocation, and assignment values at both the investment and task level. The report is grouped by resource and time period, with data displayed weekly or monthly, as well as in total. Values can be shown in hours or full-time equivalents (FTEs), supporting detailed analysis of workload and forecasted demand.
 -
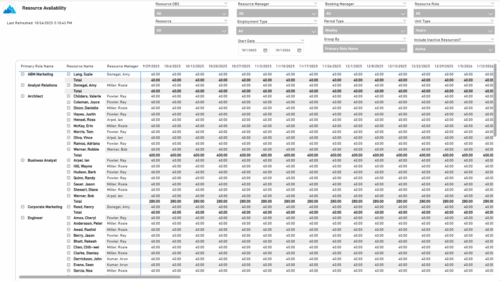 The Resource Availability report provides visibility into each resource’s available capacity across projects. It allows users to view availability by resource, grouped by either resource manager or primary role, helping identify under- or over-utilized team members. The report can display data by week, month, or in total, and amounts can be viewed in hours or full-time equivalents (FTEs).
 -
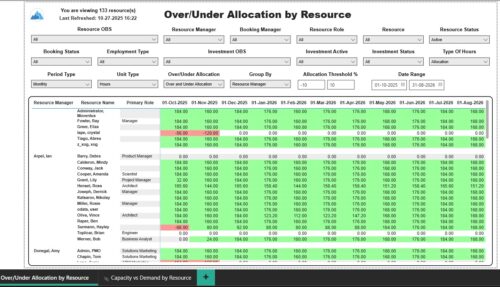 The Over/Under Allocation by Resource report displays resource remaining capacity amounts by resource. The report displays amounts by week or month. The amounts can be displayed as hours or FTEs. This report allows you to drill down to the Capacity vs. Demand by Resource report, by clicking a resource name, to see more information about the resource capacity and demand. Report Prerequisites Verify that you have completed the following prerequisites before you run this report: • The Load Data Warehouse job must be run before you run this report. If the Data Warehouse is not populated, the report will not display any data. Also, most of the report parameters do not display options.
 -
 The Resource Time Review by Manager report provides visibility into timesheet entries for each resource, organized by investment manager or resource manager. It details hours entered by day and in total for each investment and time entry, helping managers monitor time allocation and utilization across their teams. This report supports effective oversight of resource effort and project participation.
 -
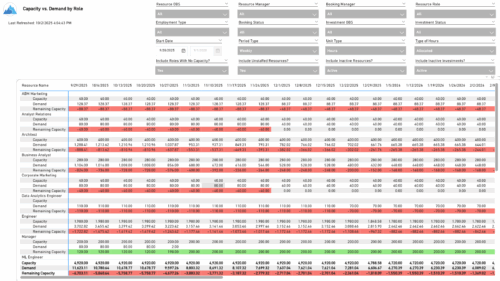 The Capacity vs. Demand by Role report provides visibility into resource utilization by comparing available capacity to actual demand across investments at the role level. It highlights capacity, demand, and remaining capacity, helping identify potential surpluses or shortfalls. Data can be viewed by week or month and displayed in either hours or full-time equivalents (FTEs) to support detailed workforce planning and analysis.
 -
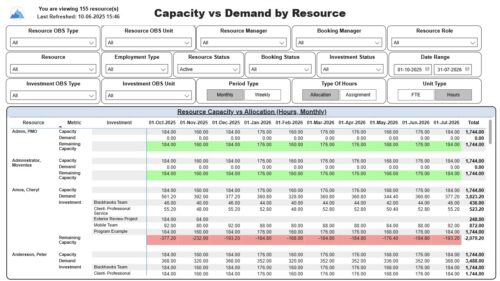 The Capacity vs. Demand by Resource report displays resource capacity and demand at the resource level across investments. The report gives you visibility into the capacity, demand, and remaining capacity by resource. The report displays amounts by week or month, and in total. The amounts might be displayed as hours or FTEs. Report Prerequisites: Verify that you have completed the following prerequisites before you run this report: • The Load Data Warehouse job must be run before you run this report. If the Data Warehouse is not populated, the report will not display any data. Also, most of the report parameters do not display options. • Resource demand allocation amounts display if the resource is allocated to at least one investment and the report display type of hours as allocations. Resource demand assignment amounts display if the resource is assigned to at least one task on the investment and the report displays type of hours as assignments.
 -
 Take your Resource Planning to the next level with itDesign’s Advanced Resource Planning add-on for Clarity.
 -
 Does your organization struggle with resource management? Have you considered creating a Resource Management Office (RMO)? Do you struggle with a lack of executive sponsorship to drive adoption? This session will review how some organizations are succeeding in driving adoption and effectively managing resources by engaging leadership, RMOs, and utilizing more dedicated resources. Learn best practices for driving effective resource management across your organization.
 -
 Do you want to talk to other Clarity customers that are using - or plan to use - resource management capabilities? In this moderated Round Table, attendees can share experiences and provide insights on process, configurations, challenges, and successes. We will have an expert panel and then divide into small groups to discuss customer selected topics. 100% sharing. 100% learning.


Copyright 2023 • Rego Consulting Corporation • Privacy Policy