-
 “Resources with No Basic Matrix Entry” portlet displays combinations of project and resource where the assigned resource does or does not have a rate established for that project. Portlet is filterable by Projects, Project ID, Resources, and Missing Rate (Yes, No, All). How does this work? The Rate Matrix Extraction job populates a record into the NBI_PROJ_RES_RATES_AND_COSTS table for every resource/project combination that meets any of the rate matrix criteria. This portlet checks that table, and sets the Missing Rate attribu
 -
“Resources with No Basic Matrix Entry” portlet displays combinations of project and resource where the assigned resource does or does not have a rate established for that project. Portlet is filterable by Projects, Project ID, Resources, and Missing Rate (Yes, No, All). How does this work? The Rate Matrix Extraction job populates a record into the NBI_PROJ_RES_RATES_AND_COSTS table for every resource/project combination that meets any of the rate matrix criteria. This portlet checks that table, and sets the Missing Rate attribu
-
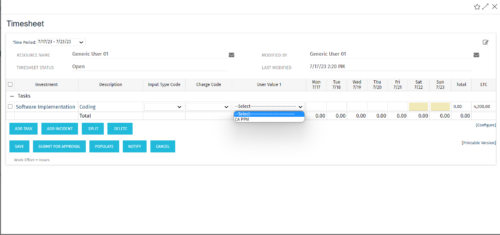 The tech-trick shows how to retrieve logged in User related values (ex: skill set) in timesheet.
 -
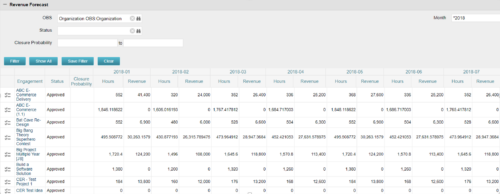
The Revenue Forecast portlet displays projected revenue at a project level broken out by month. This portlet assists in viewing all project revenue data at once and making it easily exportable. The table below describes the available filter fields in the portlet. Column Label Description OBS OBS to filter projects with Status Status of the project Closure Probability ? Months Month(s) of Project Revenue to display -
The Revenue Forecast portlet displays projected revenue at a project level broken out by month. This portlet assists in viewing all project revenue data at once and making it easily exportable. The table below describes the available filter fields in the portlet. Column Label Description OBS OBS to filter projects with Status Status of the project Closure Probability ? Months Month(s) of Project Revenue to display -
The Revenue Forecast portlet displays projected revenue at a project level broken out by month. This portlet assists in viewing all project revenue data at once and making it easily exportable. The table below describes the available filter fields in the portlet. Column Label Description OBS OBS to filter projects with Status Status of the project Closure Probability ? Months Month(s) of Project Revenue to display -
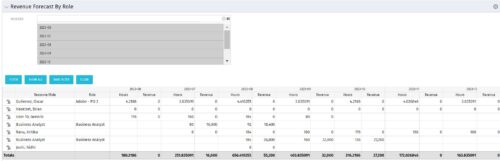 The Revenue Forecast by Role portlet displays forecasted revenue by both resource and role on the given project, broken out by month. The table below describes the available filter fields in the portlet.
Column Label Description Months Fiscal months to display -
 Out of the box, there is no way to export or report on the Modern UX Roadmap Grid view. This report allows the end user to select one or more roadmaps and provides an exportable view of several OOTB fields from those roadmaps. When exported to and open in excel, the first tab will display a combined view of all selected Roadmaps, one row for every Roadmap Item, and additional tabs will display Roadmap-specific views. Custom attributes may be added to the report by your developers.
 -
Out of the box, there is no way to export or report on the Modern UX Roadmap Grid view. This report allows the end user to select one or more roadmaps and provides an exportable view of several OOTB fields from those roadmaps. When exported to and open in excel, the first tab will display a combined view of all selected Roadmaps, one row for every Roadmap Item, and additional tabs will display Roadmap-specific views. Custom attributes may be added to the report by your developers.
-
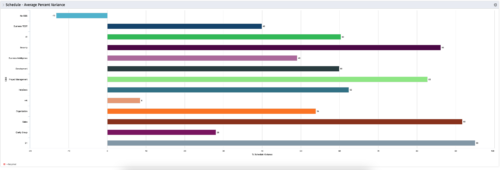 This is a graphic portlet that pulls the average schedule variance by OBS node of the project. The portlet allows you to choose any OBS that is associated to the Project Object. Users can filter by:
- OBS Type
- If the project is financially approved?
- Financial Status
-
This is a graphic portlet that pulls the average schedule variance by OBS node of the project. The portlet allows you to choose any OBS that is associated to the Project Object. Users can filter by:
- OBS Type
- If the project is financially approved?
- Financial Status
-
This is a graphic portlet that pulls the average schedule variance by OBS node of the project. The portlet allows you to choose any OBS that is associated to the Project Object. Users can filter by:
- OBS Type
- If the project is financially approved?
- Financial Status
-
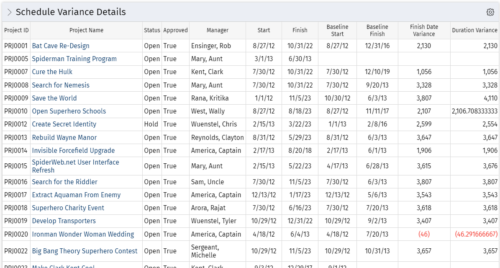 This portlet shows the variance between the schedule finish and baseline finish for projects. The portlet also displays the schedule variance: {(Finish-Start) – (Baseline Finish-Baseline Start)}.
 -
This portlet shows the variance between the schedule finish and baseline finish for projects. The portlet also displays the schedule variance: {(Finish-Start) – (Baseline Finish-Baseline Start)}.
-
This portlet shows the variance between the schedule finish and baseline finish for projects. The portlet also displays the schedule variance: {(Finish-Start) – (Baseline Finish-Baseline Start)}.
-
 Course Description: Do some folks in your organization view Clarity PPM as worthless or of little value? In this class, we will discuss how to increase the value perception of Clarity PPM and innovative ways to sell the value Clarity PPM provides to stakeholders and users.
 -
 Course description: “Are some of your users leveraging a Smartsheet add-on for project planning, or are you looking for an alternative to OWB and MSP? Learn how this new scheduling tool is making waves and adding value for project managers working within CA PPM.” Download file is the presentation slidedeck.
 -
 A Quick Reference Guide to assist in the process of staffing a Project Team in Clarity. The document uses screen shots from the Classic UX with the Phoenix theme.
 -
 A Quick Reference Guide that covers how to staff a Team in Clarity’s Modern UX. It reviewes some of the key terminology, covers Allocation vs. ETC, accessing the Staffing Tab, and viewing time-scaled allocations.
 -
 This training document is a Rego Consulting Quick Reference Guide to assist with the process of staffing a Team in Clarity’s Modern User Experience. The document starts with a review of common terms, then setting default allocation, Allocation vs ETC, and then the Staffing Tab.
 -
 Course Description: How do companies track stage gates within Clarity PPM? This session will review some best practices for tracking, monitoring, and approving stage gates within Clarity PPM. We will also discuss pros and cons of various options to help you select the best method for your company.
 -
 The Status Report Publish workflow process pushes values from the status report sub-object to the parent project object. The process is started when the user ticks the “Publish” Boolean field on the status report (custom field added). This workflow will update the project object with the overall status indicator, the status comment, the previous overall status, and the as of date. This eliminates the project manager having to update the fields in both the status report and the project overall.
 -
The Status Report Publish workflow process pushes values from the status report sub-object to the parent project object. The process is started when the user ticks the “Publish” Boolean field on the status report (custom field added). This workflow will update the project object with the overall status indicator, the status comment, the previous overall status, and the as of date. This eliminates the project manager having to update the fields in both the status report and the project overall.
-
 This training document is a Rego Consulting Quick Reference Guide to assist with Status Reporting in Clarity’s Modern User Experience. The document reviews Status Reporting via the Status Tab and the Status Reporting Tab – Grid View.


Copyright 2023 • Rego Consulting Corporation • Privacy Policy