-
 Part of the Business Transformation collection, this portlet displays count of the planned benefits (savings) per project manager. It also displays if any of the planned benefits are Critical/ At Risk / On Track, along with the total planned benefit amount.
 -
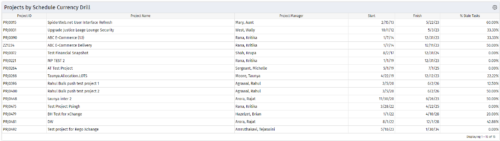
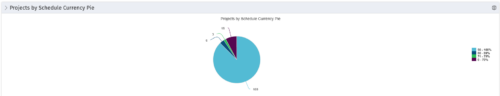 Pie Chart Portlet displays counts of active projects with various Stale ratings. Calculation is Percent Stale Tasks = number of open (not completed) tasks with a finish date over 15 days old, divided by total open tasks. Filterable by OBS structure and project manager. Data label = project count. Mouse-over and Legend labels = stale rating. More than 90% Stale means 90 to 100% of open tasks on a project have finish dates older than 15 days. More than 80% Stale means 80 to 89% of open tasks on a project have finish dates older than 15 days. Less than 70% Stale means fewer than 70% of open tasks on a project have finish dates older than 15 days. By clicking on pie slice, a drilldown grid portlet appears with listing of projects and their Stale Ratings.
 -
Pie Chart Portlet displays counts of active projects with various Stale ratings. Calculation is Percent Stale Tasks = number of open (not completed) tasks with a finish date over 15 days old, divided by total open tasks. Filterable by OBS structure and project manager. Data label = project count. Mouse-over and Legend labels = stale rating. More than 90% Stale means 90 to 100% of open tasks on a project have finish dates older than 15 days. More than 80% Stale means 80 to 89% of open tasks on a project have finish dates older than 15 days. Less than 70% Stale means fewer than 70% of open tasks on a project have finish dates older than 15 days. By clicking on pie slice, a drilldown grid portlet appears with listing of projects and their Stale Ratings.
-
 Part of the Business Transformation collection, this pie chart portlet displays realized benefit, grouped by location of project. This provides the PM with a holistic view of benefits realized across the geographical locations.
 -
Part of the Business Transformation collection, this pie chart portlet displays realized benefit, grouped by location of project. This provides the PM with a holistic view of benefits realized across the geographical locations.
-
 Part of the Business Transformation collection, this line chart portlet displays realized vs planned benefits overtime, for portfolio investments. This provides the PfM with a holistic view of benefits planned vs realized over a period of time.
 -
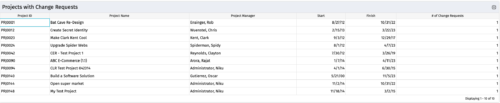
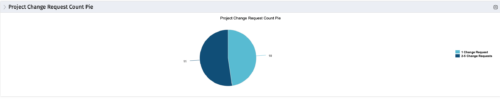 The portlet, Project Change Request Count Pie with drill-down is a simple pie that displays the total count of projects in the pie. The slices are:
- Projects with 0 change requests
- Projects with 1 change request
- Projects with 2-5 change requests
- Projects with 5-10 change requests
- Projects with over 10 change requests
-
The portlet, Project Change Request Count Pie with drill-down is a simple pie that displays the total count of projects in the pie. The slices are:
- Projects with 0 change requests
- Projects with 1 change request
- Projects with 2-5 change requests
- Projects with 5-10 change requests
- Projects with over 10 change requests
-
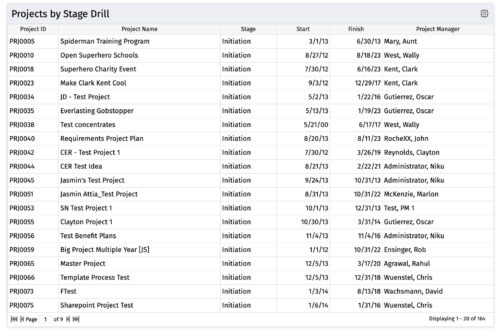
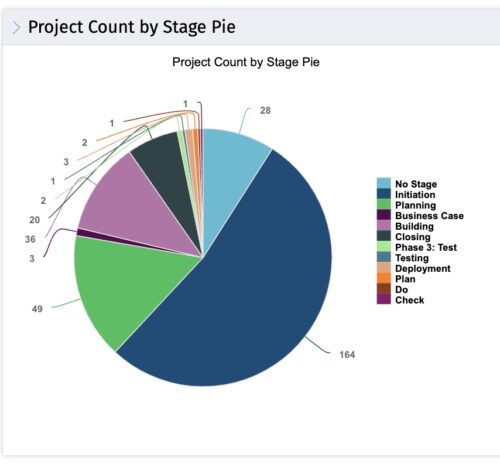 The portlet, Count by Stage with Drilldown is a simple pie based on stage OOTB field. The drill down portlet has stage as a column. Clicking on any of the segments, e.g. Initiation, redirects to the Projects by Stage Drill portlet.
 -
The portlet, Count by Stage with Drilldown is a simple pie based on stage OOTB field. The drill down portlet has stage as a column. Clicking on any of the segments, e.g. Initiation, redirects to the Projects by Stage Drill portlet.
-
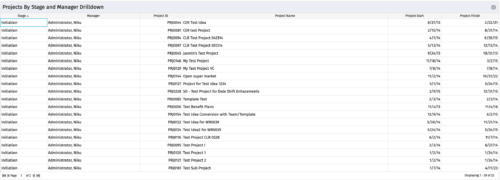
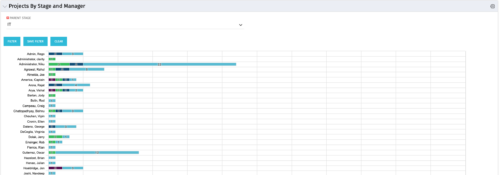 Horizontal Bar Chart displays one bar per manager (manager name on vertical axis). Horizontal axis shows project count. Filtered by Parent Stage. Each bar shows color coded stages, where length of each color is proportional to the count. Data label = count by stage. Mouse-over = stage name and percent count of total projects. Legend = child stage names. Drilldown functionality: Clicking on a bar color yields a project grid portlet with projects in that stage for that manager.
 -
Horizontal Bar Chart displays one bar per manager (manager name on vertical axis). Horizontal axis shows project count. Filtered by Parent Stage. Each bar shows color coded stages, where length of each color is proportional to the count. Data label = count by stage. Mouse-over = stage name and percent count of total projects. Legend = child stage names. Drilldown functionality: Clicking on a bar color yields a project grid portlet with projects in that stage for that manager.
-
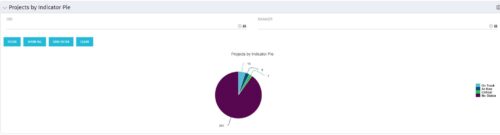 Pie Chart displays counts of all projects by out-of-box Status Indicator attributes. Filterable by OBS structure and Manager. Data label displays count. Mouse-over and Legend display Indicator name. Chart also displays count for projects with no Indicator.
 -
Pie Chart displays counts of all projects by out-of-box Status Indicator attributes. Filterable by OBS structure and Manager. Data label displays count. Mouse-over and Legend display Indicator name. Chart also displays count for projects with no Indicator.
-

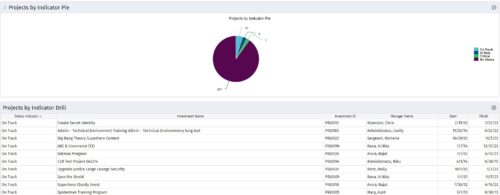 Pie Chart displays counts of all projects by out-of-box Status Indicator attribute. Filterable by OBS structure and Manager. Data label displays count. Mouse-over and Legend display Indicator name. Chart also displays count for projects with no Indicator. By clicking on a pie slice, a grid portlet appears displaying all projects with that indicator value.
 -
Pie Chart displays counts of all projects by out-of-box Status Indicator attribute. Filterable by OBS structure and Manager. Data label displays count. Mouse-over and Legend display Indicator name. Chart also displays count for projects with no Indicator. By clicking on a pie slice, a grid portlet appears displaying all projects with that indicator value.
-
 Pie Chart displays total Ideas by Priority, filterable by Active / Inactive and by OBS structure. Data Label and Mouse-over label display counts by Priority. Legend shows Priority Name. Chart also shows Ideas with No Priority.
 -
 Pie Chart displays count of all Ideas by Department. Filterable by Active and Inactive, by OBS, and by Department Manager. Data label and mouse-over show department counts. Legend displays department names.
 -
Pie Chart displays count of all Ideas by Department. Filterable by Active and Inactive, by OBS, and by Department Manager. Data label and mouse-over show department counts. Legend displays department names.
-
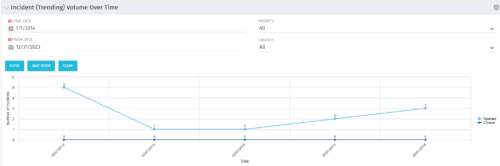 This view depicts trends of created and resolved Incidents over time, grouped by month. The count of incidents opened is determined by the Created Date of the Incident, and the count of Incidents closed is determined by the Resolution Date of the Incident. The view is filterable by Priority and Urgency as well as a date range. NOTE: The values returned are the total sum for a given month, not a cumulative total over time.
 -
This view depicts trends of created and resolved Incidents over time, grouped by month. The count of incidents opened is determined by the Created Date of the Incident, and the count of Incidents closed is determined by the Resolution Date of the Incident. The view is filterable by Priority and Urgency as well as a date range. NOTE: The values returned are the total sum for a given month, not a cumulative total over time.
-
This view depicts trends of created and resolved Incidents over time, grouped by month. The count of incidents opened is determined by the Created Date of the Incident, and the count of Incidents closed is determined by the Resolution Date of the Incident. The view is filterable by Priority and Urgency as well as a date range. NOTE: The values returned are the total sum for a given month, not a cumulative total over time.


Copyright 2023 • Rego Consulting Corporation • Privacy Policy