-
 A Quick Reference guide to assist in the creation and management of project cost and budget plans in Clarity’s Modern UX. Reviews the access of project details from the Project Grid or Tile views, creation of a cost and budget plan, and edits to those plans.
 -
 This training document is a Rego Consulting Quick Reference Guide to assist with accessing Project Financials in Clarity’s Modern User Experience.
 -
 A Quick Reference Guide to assist with the creating and managing of Cost Plans in Clarity. The document uses screen shots from the Classic UX using the Phoenix theme.
 -
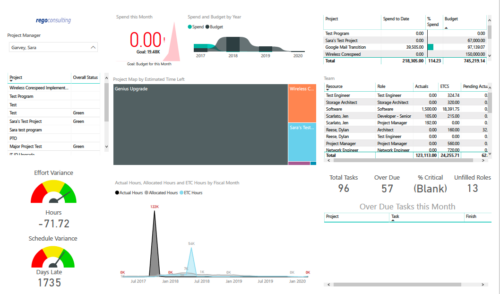 Project Health by PM is a dashboard that contains multiple visualizations showing various KPIs of projects managed by a project manager. Dashboard shows KPIs like summary of Over Due tasks, Critical tasks, Unfilled roles on Project, Effort and Schedule variance etc. Spend this month – Area graph that shows Actual vs Budget cost for current month. Spend and Budget by Year – Ribbon chart that shows yearly distribution of Actual vs Budget cost. Project Map by Estimated time left – Tree map representing ETC hours remaining on each project. Team – Grid section that shows list of team members with respective Actuals and ETC hours. Actual Hours, Allocated Hours and ETC Hours by Fiscal Month – Area graph that shows monthly distribution of Actuals vs Allocation vs ETC.
 -
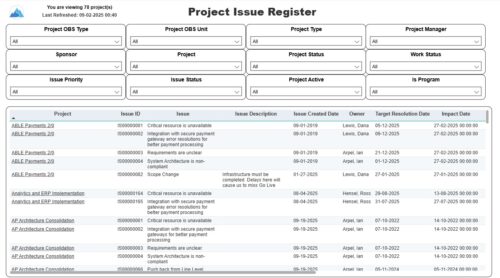 The Project Issue Register report displays comprehensive information for each project issue. The issue register also provides the option to display items that are associated to the issue such as notes, action items, and tasks. Report Prerequisites Verify that you have completed the following prerequisites before you run this report: • The project must have at least one issue for the project to display in the report. • The issue properties must have fields such as description, category, resolution, target resolution, impact date, and originating ID completed for them to display data in the report. The issue name, issue ID, priority, status, and owner are required in Classic PPM so they always display data.
 -
 A slide deck used in Rego’s training classed for Project Management in the Modern User Experience. Reviews terms and definitions, the OBS, Work Breakdown Structure, Templates, Roles and Responsibilities, Allocation vs ETC, Accessing Projects, Project Creation, Staffing, Tasks, Assignments, To Dos, Project Financials, and more.
 -
 Rego’s training deck for Project Management in Clarity using the Classic UX and the Phoenix theme. Reviews the OBS, WBS, Templates, Terms, Allocation vs ETC and more.
 -
 Course Description: Do you want to improve the success of your projects? This class will discuss some lessons learned on making projects more successful. We will discuss things like: • Developing robust test plans, creating effective use and test cases, and implementing test scripts that make sense.
- Why failures occur and what you can do to minimize the impact and plan for success—including a case study on lessons learned.
- Developing, testing, fine-tuning, and executing deployment plans for success.
-
 Do you want to understand the OOTB configuration and functionality of project management? In this class, we will review the OOTB objects, views, and functions of projects, financial plans, tasks/assignments, IRC, and other related areas. We will cover both classic and new UX highlighting differences.
 -
 Course Description: Do you want to talk to other customers that are using or plan to use project management? In this moderated round table, customers can share experiences and provide insights on process, configurations, challenges, and successes. We will divide into small groups and discuss customer selected topics—100% sharing
 -
 Project Manager- Resource/Compliance report provides project managers a single place to view Compliance status for various critical KPIs. All the KPIs are depicted in various visualizations.
- Unfilled Demand: Donut chart that gives you the count of roles (within projects) that are not filled by resources.
- # Of New team members: Scorecard that displays the count of new team members added to the projects.
- Resource Constraints: Donut chart that gives you the count of Over utilized and underutilized resources
- Unsubmitted Time: Dial gauge that displays the count of resources that did not submit time.
- Stale Tasks: Dial gauge that displays the count of tasks that are past their due date
- Status Report Compliance: Dial gauge that displays the compliance of status reports for various projects.
-
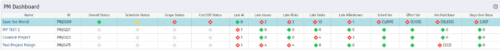 The PM Dashboard portlet provides an overview of all projects for which the user is the Project Manager without navigating to and opening each project individually. All critical information related to the project status is displayed in this portlet. Status indicators display the project’s statuses. Graphical stoplights and numbers provide an overview of all late Action items, Issues, Risks, Tasks, and Milestones.
 -
The PM Dashboard portlet provides an overview of all projects for which the user is the Project Manager without navigating to and opening each project individually. All critical information related to the project status is displayed in this portlet. Status indicators display the project’s statuses. Graphical stoplights and numbers provide an overview of all late Action items, Issues, Risks, Tasks, and Milestones.
-
 Course Description: This class will provide a list of daily and weekly activities that every project manager should follow to leverage Clarity PPM more effectively.
 -
 The Project Risk Register report provides visibility into project risks, including detailed information on each risk and its associated items such as notes, action items, tasks, and related risks or issues. Results can be grouped by project or viewed without grouping to support flexible analysis. Interactive visuals make it easy to track, monitor, and manage risks across projects.
 -
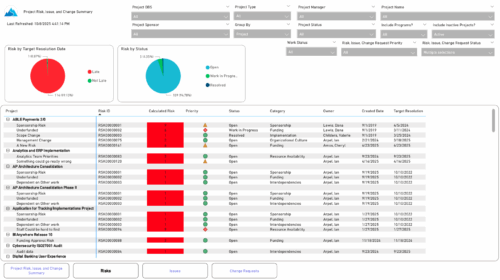 The Project Risk, Issue, and Change Summary report provides an overview of project health by visualizing risks, issues, and change requests. It includes pie charts that display counts by target resolution or expected close date, as well as by status. A detailed table lists each item’s name, ID, priority, status, category, owner, creation date, and resolution or close date. Results can be grouped by project or viewed without grouping to support flexible analysis and tracking.
 -
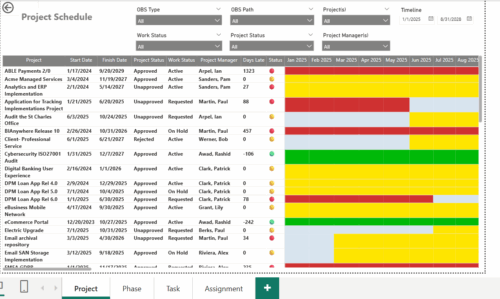 The Project Schedule report provides visibility into project schedule, including detailed information on days late, status and its associated items such as detailed info of schedule on Phase level, Task level and assignment level. Results are grouped by project in Phase, Task and assignment sections or can be viewed without grouping to support flexible analysis for projects. Interactive visuals make it easy to track, monitor, and manage schedule across projects.
 -
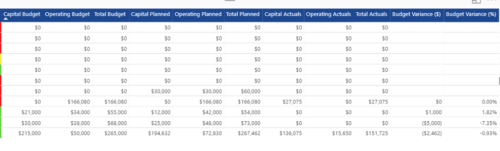
 The portlet shows the Overall Status and Budget Status and Amounts. It displays one row per project. The portlet shows the following main fields: Overall Status, Budget Status, Capital Budget, Operating Budget, Total Budget, Capital Planed, Operating Planned, Total Planned, Capital Actuals, Operating Actuals, Total Actuals, Budget Variance ($), Budget Variance (%) Displaying the budget variance allows the PM to understand of the project is over / under spent, and thus the costs planning needs to be re-visited.
 -
The portlet shows the Overall Status and Budget Status and Amounts. It displays one row per project. The portlet shows the following main fields: Overall Status, Budget Status, Capital Budget, Operating Budget, Total Budget, Capital Planed, Operating Planned, Total Planned, Capital Actuals, Operating Actuals, Total Actuals, Budget Variance ($), Budget Variance (%) Displaying the budget variance allows the PM to understand of the project is over / under spent, and thus the costs planning needs to be re-visited.
-
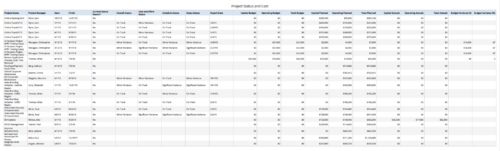 Project Status and Costs report gives the Project Manager a single place to view various Project Statuses ( Cost and Effort, Schedule, Scope and Overall ) and Costs ( Planned, Budget & Actuals ) for multiple projects. User can further narrow their search by OBS Type & Path, Project Name, Project Manager and Is Project Active?.
 -
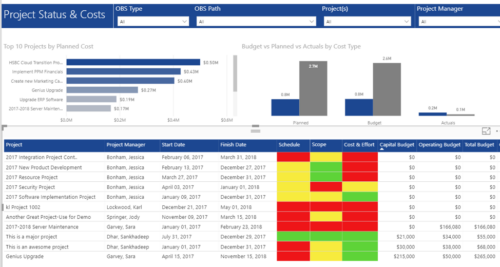 Project Status and Costs report has the details of the Project Schedule, Scope, Cost and Effort Statuses along with Planned, Budget & Actuals costs. There is also graphical representation that shows Top 10 projects by Planned Cost, Budget vs Planned vs Actuals by Cost Type. User can further narrow their search by OBS Type & Path, Project(s) and Project Manager.
 -
 The Project Status Detail report provides a comprehensive view of each project’s key elements, including team allocations, major milestones, risks, issues, and change requests. It highlights the most relevant project indicators to give stakeholders a clear understanding of project health and progress. This report supports detailed tracking and review of project performance across multiple dimensions.
 -
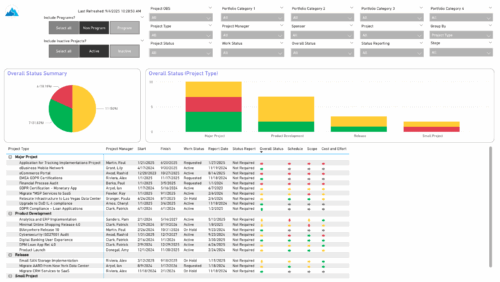 The Project Status Report List provides a consolidated view of project health, including schedule dates, work status, and key status indicators. Users can group results by Portfolio Category, Overall Status, Project Type, Stage, Project Manager, Sponsor, or OBS Level, with the report dynamically adjusting its columns based on the grouping selected. Visuals include an overall status pie chart that shows the percentage of projects by status color, and a column chart that breaks down project counts by status, aligned to the chosen grouping option.
 -
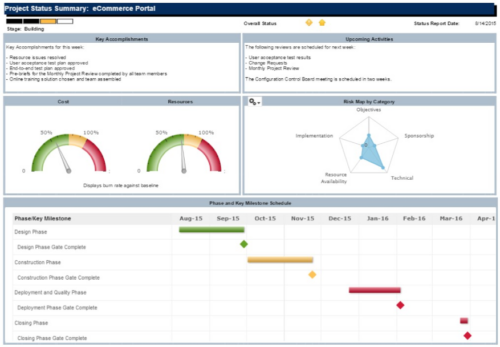 The Project Status Summary report is a transaction based Jaspersoft report that does not require the Load Jaspersoft Datawarehouse job to be run. The report will pull real-time data from the transaction tables in Clarity. This report can be run from either the Advanced Reporting or Reports and Jobs area within Clarity. The Project Status Summary report displays summary information about a project, including current stage, overall status, key accomplishments, upcoming activities, the cost and amount of resources that are consumed, mapped risks indicating categories with a high number of risks, and a high-level Gantt chart displaying information about the project phases and key milestones.
 -
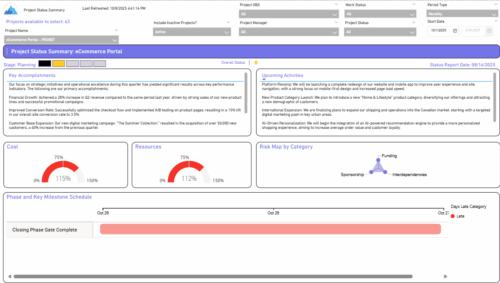 The Project Status Summary report highlights the overall health and progress of a project by summarizing key information such as current stage, status indicators, major accomplishments, upcoming activities, and resource and cost consumption. It also visualizes risk concentration across categories and includes a high-level Gantt chart showing major phases and milestones. This report provides a clear snapshot of project performance for quick executive or stakeholder review.
 -
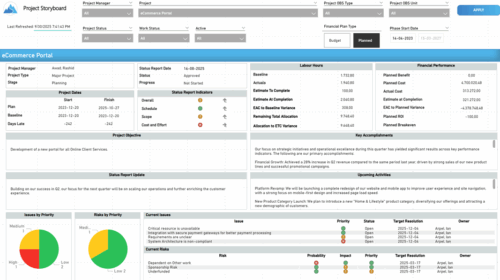
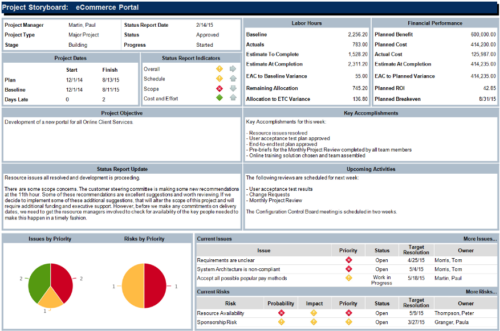 The Project Storyboard report is a transaction based Jaspersoft report that does not require the Load Jaspersoft Datawarehouse job to be run. The report will pull real-time data from the transaction tables in Clarity. This report can be run from either the Advanced Reporting or Reports and Jobs area within Clarity. The Project Storyboard report shows key aspects of a project that is organized in separate frames. Each frame in the report displays project information such as project dates, project objective, the amount, and cost of resources that are planned and actual, key accomplishments, upcoming activities, current issues and risks, and the project progress toward goals. This report can be used to analyze the project earned value and track work performance to account for cost and schedule variances.
 -
 The Time Compliance report displays different frame in the displaying project information such as project dates, project objective, the amount, and cost of resources that are planned and actual, key accomplishments, upcoming activities, current issues and risks, and the project progress toward goals, and some EVM indicators for its phases.
 -
 Project managers may use this portlet to show the planned effort and the remaining effort on projects. Includes actual hours as well as estimate at completion. You may narrow the results by filtering by project name, project manager, project OBS, or active flag. The portlet will display each project by ID, name, project manager, planned effort (total allocation hours), actual hours, remaining effort (ETC), and estimate at complete (actual + ETC).
 -
Project managers may use this portlet to show the planned effort and the remaining effort on projects. Includes actual hours as well as estimate at completion. You may narrow the results by filtering by project name, project manager, project OBS, or active flag. The portlet will display each project by ID, name, project manager, planned effort (total allocation hours), actual hours, remaining effort (ETC), and estimate at complete (actual + ETC).
-
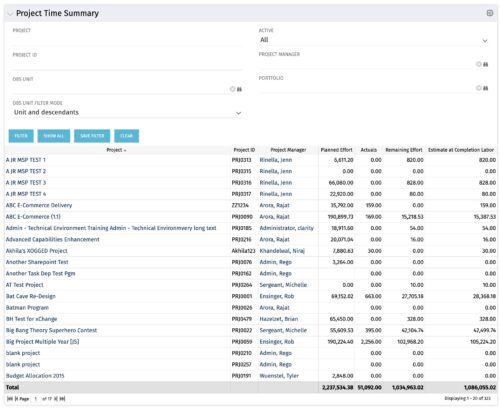
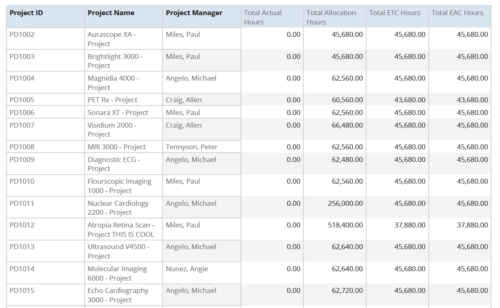 Project Time Summary report provides the project manager a single place to view Actual hours, Allocation hours, ETC hours and EAC hours for all filtered projects. It also displays Project ID, Project Name and Project Manager. User can further narrow their search by OBS Type & Path, Project Name, Project ID, Project Manager, Task Name, Project Status, Project Stage, Project Role, Is Active? and Is Template?.
 -
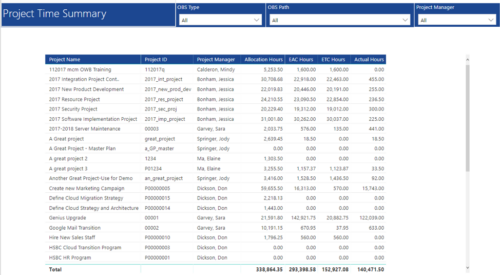 Project Time Summary report provides view of Allocation hours, EAC hours, ETC hours and Actual hours for Projects. User can further narrow their search by OBS Type & Path and Project Manager.
 -
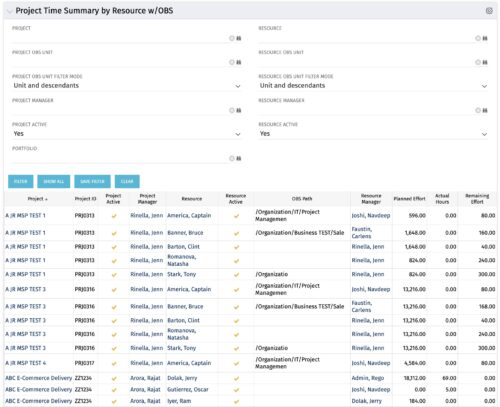 The purpose is to show actual hours, planned effort and remaining effort at the resource level, with the addition of OBS levels to support filtering and manipulation of the exported data.
 -
The purpose is to show actual hours, planned effort and remaining effort at the resource level, with the addition of OBS levels to support filtering and manipulation of the exported data.


Copyright 2023 • Rego Consulting Corporation • Privacy Policy