-
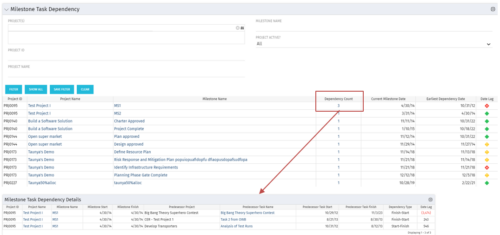 The Milestone Task Dependency portlet shows the milestone task dependency count and has a drilldown to the details. The portlet looks at the dependency impact on milestones, and is not limited to just dependencies that are on different projects. The lag days calculation is based off of the maximum dependency impact and the drilldown portlet (Milestone Task Dependency Details :::: rego_milestone_dependency_det)shows the details for each.
 -
The Milestone Task Dependency portlet shows the milestone task dependency count and has a drilldown to the details. The portlet looks at the dependency impact on milestones, and is not limited to just dependencies that are on different projects. The lag days calculation is based off of the maximum dependency impact and the drilldown portlet (Milestone Task Dependency Details :::: rego_milestone_dependency_det)shows the details for each.
-
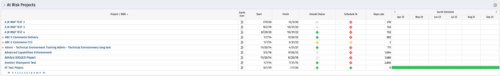 Part of the Business Transformation collection, this bar-chart portlet displays investments and (if exists) any child investments, which are at risk with regard to the schedule of the investments.
 -
Part of the Business Transformation collection, this bar-chart portlet displays investments and (if exists) any child investments, which are at risk with regard to the schedule of the investments.
-
 Part of the Business Transformation collection, this bar-chart portlet displays number of investments per stage. This provides a holistic overview of where the projects are within the organization.
 -
Part of the Business Transformation collection, this bar-chart portlet displays number of investments per stage. This provides a holistic overview of where the projects are within the organization.
-
Part of the Business Transformation collection, this bar-chart portlet displays number of investments per stage. This provides a holistic overview of where the projects are within the organization.
-
 Funnel Chart displays aggregated counts of Ideas by “Idea Progress”, a custom attribute. Chart shows Idea Progress names in legend, and count total is available as a mouse-over. No filters available on this portlet.
 -
Funnel Chart displays aggregated counts of Ideas by “Idea Progress”, a custom attribute. Chart shows Idea Progress names in legend, and count total is available as a mouse-over. No filters available on this portlet.
-
Funnel Chart displays aggregated counts of Ideas by “Idea Progress”, a custom attribute. Chart shows Idea Progress names in legend, and count total is available as a mouse-over. No filters available on this portlet.
-
 This portlet will allow administrators or other managers to see what resources have been granted instance rights to any investment. Filtering is available by resource, investment or right.
 -
This portlet will allow administrators or other managers to see what resources have been granted instance rights to any investment. Filtering is available by resource, investment or right.
-
This portlet will allow administrators or other managers to see what resources have been granted instance rights to any investment. Filtering is available by resource, investment or right.
-
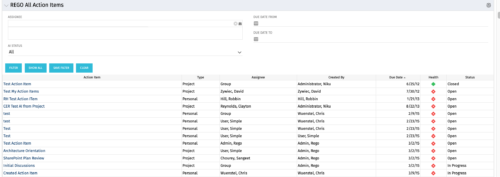 The All Action Items portlet provides detail on all actions items, including the name, type, assignee, status, due date, health indicator and creator of the action item. The portlet can be filtered by project, assignee, AI status, and due date range.
 -
The All Action Items portlet provides detail on all actions items, including the name, type, assignee, status, due date, health indicator and creator of the action item. The portlet can be filtered by project, assignee, AI status, and due date range.
-
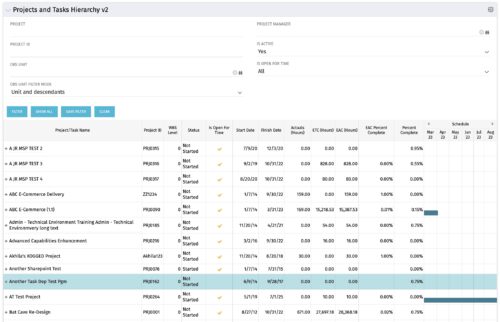 Grid Portlet displays project and task data--including name, dates, status, effort, %Complete, and schedule. Portlet initially displays project data. But there is a + sign toggle, which, when clicked, reveals task data, and the toggle becomes a – sign. User can choose to Automatically Expand all levels from Options Icon>Configure>List Column Section>Options. Portlet supports up to 10 levels of WBS. Portlet filterable by project name and ID, OBS structure, manager name, active/inactive, and open for time entry.
 -
Grid Portlet displays project and task data--including name, dates, status, effort, %Complete, and schedule. Portlet initially displays project data. But there is a + sign toggle, which, when clicked, reveals task data, and the toggle becomes a – sign. User can choose to Automatically Expand all levels from Options Icon>Configure>List Column Section>Options. Portlet supports up to 10 levels of WBS. Portlet filterable by project name and ID, OBS structure, manager name, active/inactive, and open for time entry.
-
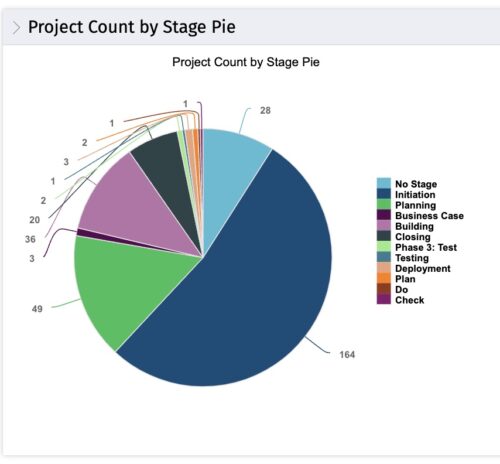 This portlet displays the projects by Stage in a pie chart. Every piece of the pie chart represents a stage of the Project Management methodology applied. The portlet also shows the number of projects on each stage. The legend displays all the different project stages appearing on the portlet. This portlet can be filtered to show only projects from a particular OBS unit or for a particular Project Manager.
 -
This portlet displays the projects by Stage in a pie chart. Every piece of the pie chart represents a stage of the Project Management methodology applied. The portlet also shows the number of projects on each stage. The legend displays all the different project stages appearing on the portlet. This portlet can be filtered to show only projects from a particular OBS unit or for a particular Project Manager.
-
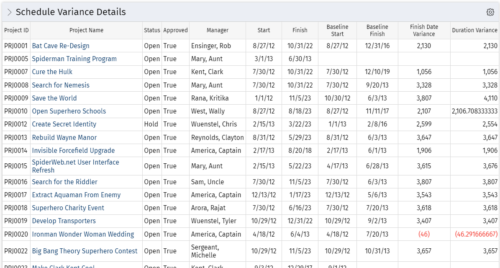 This portlet shows the variance between the schedule finish and baseline finish for projects. The portlet also displays the schedule variance: {(Finish-Start) – (Baseline Finish-Baseline Start)}.
 -
This portlet shows the variance between the schedule finish and baseline finish for projects. The portlet also displays the schedule variance: {(Finish-Start) – (Baseline Finish-Baseline Start)}.
-
This portlet shows the variance between the schedule finish and baseline finish for projects. The portlet also displays the schedule variance: {(Finish-Start) – (Baseline Finish-Baseline Start)}.
-
 This portlet shows the variance between the budgeted cost and the planned cost for projects. This allows for the variance to be displayed between what was planned and what was approved. This provides the PMs with the ability to better plan the costs.
 -
This portlet shows the variance between the budgeted cost and the planned cost for projects. This allows for the variance to be displayed between what was planned and what was approved. This provides the PMs with the ability to better plan the costs.
-
This portlet shows the variance between the budgeted cost and the planned cost for projects. This allows for the variance to be displayed between what was planned and what was approved. This provides the PMs with the ability to better plan the costs.
-
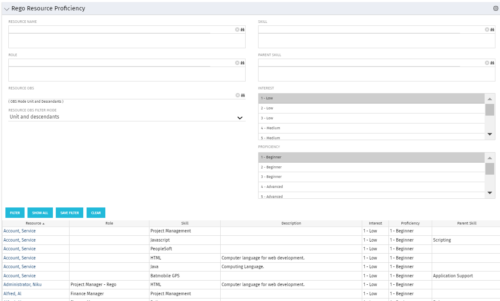 This grid displays Skill Proficiency and Interest Level by Resource. Users can utilize this view to search for Resources by Skill, Parent Skill, Interest, Role, Parent Role, Resource and Resource OBS. This portlet grants a Project Manager or Resource Manager the ability to determine which Resources best fit the needs for their project.
 -
This grid displays Skill Proficiency and Interest Level by Resource. Users can utilize this view to search for Resources by Skill, Parent Skill, Interest, Role, Parent Role, Resource and Resource OBS. This portlet grants a Project Manager or Resource Manager the ability to determine which Resources best fit the needs for their project.
-
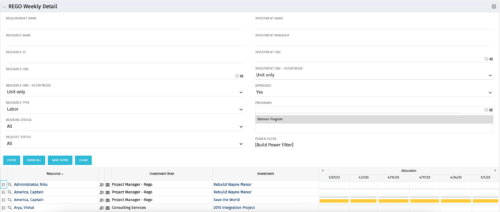 This is the same portlet as the out of the box Weekly Detail with an additional filter element for Program (multiple select). Portlet displays resource allocations graphically for each project in the specified program(s), for the next six weekly periods. Portlet filterable by numerous project, resource, and assignment attributes. Graphical representation shows Resource Availability Threshold and Allocation in hours, as a mouse-over.
 -
This is the same portlet as the out of the box Weekly Detail with an additional filter element for Program (multiple select). Portlet displays resource allocations graphically for each project in the specified program(s), for the next six weekly periods. Portlet filterable by numerous project, resource, and assignment attributes. Graphical representation shows Resource Availability Threshold and Allocation in hours, as a mouse-over.
-
 “Resources with No Basic Matrix Entry” portlet displays combinations of project and resource where the assigned resource does or does not have a rate established for that project. Portlet is filterable by Projects, Project ID, Resources, and Missing Rate (Yes, No, All). How does this work? The Rate Matrix Extraction job populates a record into the NBI_PROJ_RES_RATES_AND_COSTS table for every resource/project combination that meets any of the rate matrix criteria. This portlet checks that table, and sets the Missing Rate attribu
 -
“Resources with No Basic Matrix Entry” portlet displays combinations of project and resource where the assigned resource does or does not have a rate established for that project. Portlet is filterable by Projects, Project ID, Resources, and Missing Rate (Yes, No, All). How does this work? The Rate Matrix Extraction job populates a record into the NBI_PROJ_RES_RATES_AND_COSTS table for every resource/project combination that meets any of the rate matrix criteria. This portlet checks that table, and sets the Missing Rate attribu
-
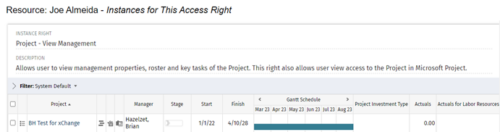
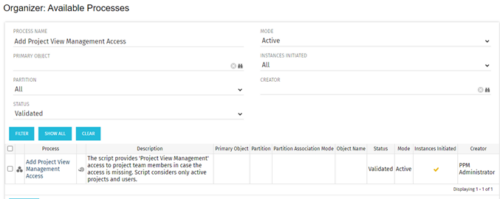 This process grants Project Management instance rights to all of the project team members within the program hierarchy. Allows users to view management properties, roster and key tasks of the project. This also allows user view access to the project in Microsoft Project.
 -
This process grants Project Management instance rights to all of the project team members within the program hierarchy. Allows users to view management properties, roster and key tasks of the project. This also allows user view access to the project in Microsoft Project.


Copyright 2023 • Rego Consulting Corporation • Privacy Policy