-
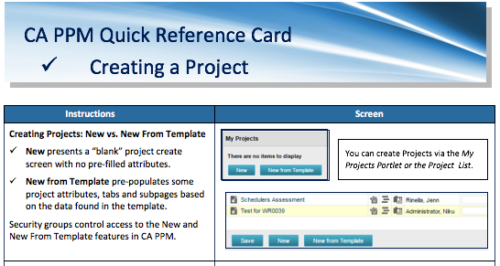 A Quick Reference Card to assist in creating a project in CA PPM. Reviews options of creating from New or New from Template.
 -
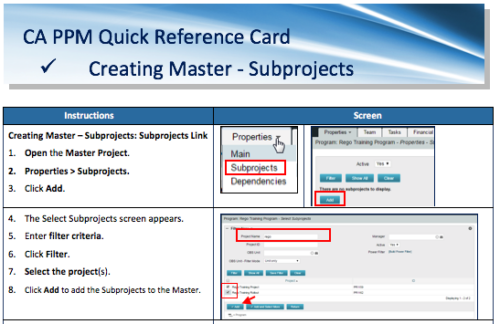 A Quick Reference Card to assist in the creation of Master-Subprojects in CA PPM.
 -
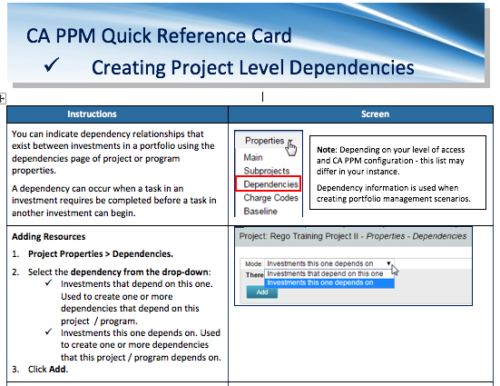 A Quick Reference Card to assist in the creation of project level dependencies. You can create dependency relationships that exist between investments in a portfolio using the dependencies page of project or program properties. A dependency can occur when a task in an investment requires to be completed before a task in another investment can begin.
 -
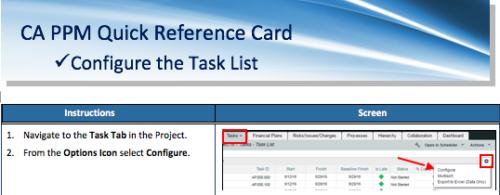 A Quick Reference Card to assist as you configure the Task List under the Task Tab on the project. You have the option to remove or add fields to the Task List.
 -
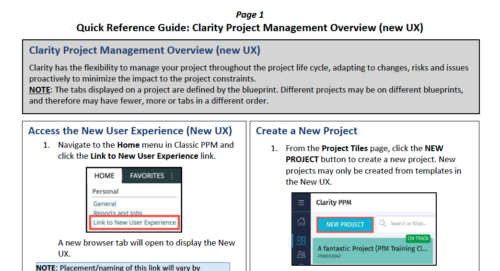 Clarity has the flexibility to manage your project throughout the project life cycle, adapting to changes, risks and issues proactively to minimize the impact to the project constraints. NOTE: The tabs displayed on a project are defined by the blueprint. Different projects may be on different blueprints, and therefore may have fewer, more or tabs in a different order.
 -
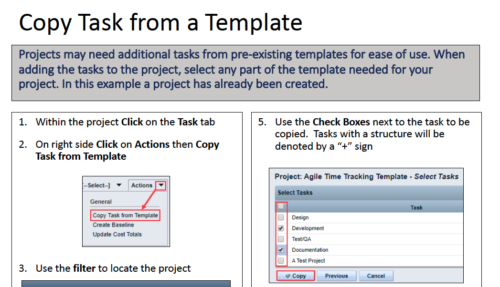 Projects may need additional tasks from pre-existing templates for ease of use. When adding the tasks to the project, select any part of the template needed for your project. In this Quick Reference Guide, a project has already been created.
 -
 Rego’s course materials for managing projects with Clarity PPM. This slide deck is created using Clarity version 15.6 and focuses on the Classic user interface. The course material covers the following:
- Project Management Overview
- Managing Projects
- Staff the Team
- Work Breakdown Structure (WBS)
- Resource Assignments to Tasks
- Clarity PPM Autoschedule
- Financial Management
- Risks, Issues, and Change Requests
- Controlling a Project
- Program Management
- Portlets and Reports
- Clarity PPM New UX – Life of the PM Interface
-
 Finding the right project manager can be tricky. How do you know which candidates have the appropriate leadership, forecasting, and problem-solving skills? Interviewing strategies can make all the difference. This paper discusses important ways you can prepare for a project manager interview. It points out hazards to sidestep and best practices for identifying candidates with the right proficiency. This White Paper is downloaded from the Rego Consulting site. You will be asked to provide your email address and current ppm tool. - http://info.regoconsulting.com/how-to-hire-the-right-pm ** No Download - Do not Add to Cart **
 -
 This paper will help you launch a PMO—or facelift the one you’ve got—by making sure your PMO charter can handle strategic heavy lifting. It covers everything from getting stakeholder buy-in to achieving successful adoption throughout your organization. This White Paper is downloaded from the Rego Consulting site. You will be asked to provide your email address and current ppm tool. - http://info.regoconsulting.com/launch-pmo-whitepaper ** No Download - Do not Add to Cart **
 -
 Today, most high-performing organizations recognize that moving from project-funding to product-funding is necessary for achieving business agility. What doesn't exist in the industry is guidance on how to support the transition from a tooling perspective. In this session, Rego Expert Guide Robert Sirard presents a practical and tactical approach to using Clarity's PPM software and Rally's Agile software together to plan, track, monitor, and deliver products. At Rego, we realize that not everything needs to be done in an Agile manner, so Robert will discuss how this approach also supports a mix of traditional and Agile investments. ** No Download - Do not Add to Cart ** There is no download for this content. Follow the link to view - http://info.regoconsulting.com/product-funding-clarity-rally-may-2021
 -
 ** No Download - Do not Add to Cart ** As the world’s largest advanced wastewater treatment plant operator, DC Water depends on a well-designed and comprehensive Project Management Office (PMO) to ensure that its 2.1 million customers have safe drinking water. In this webinar, you'll learn how DC Water joined with Rego to construct an award-winning, metrics-based PMO using Rego’s Clarity innovations. You’ll learn how their partnership resulted in a PMO that: - Drives effective Demand and Portfolio Management for IT projects and programs - Fosters real-time communication between Clarity and Microsoft 365 to keep DC Water’s Management team and Project Management community informed - Allows the IT PMO to measure progress on objectives through metrics ** No Download ** follow this link to sign up to view the recorded webinar - http://info.regoconsulting.com/how-dc-water-partnered-with-rego-march-2021
 -
 ** No Download - Do not Add to Cart ** Join Rego expert guide Dave Gubeno, Will Ross, and Chris Phillips for an engaging and informative webinar that will explain the definition, purpose, and development of Clarity metrics. Their discussion will also include: A description of the differences between metrics and key performance indicators An introduction to the Rego Adoption Metrics Framework lifecycle The presentation of pre-defined Rego Adoption Metrics for Projects and Resources An introduction to a set of Clarity portlets used to view the metrics http://info.regoconsulting.com/clarity-adoption-metrics-september-2020
 -
 ** No Download - Do not Add to Cart ** Organizational metrics that support any Agile methodology Yes–it's possible. Join our Rego expert guides to learn about industry-proven Agile metrics as well as new ideas to measure success across multiple levels of your value stream Nothing to Download - See link below. http://info.regoconsulting.com/agile-metrics-july-2020
 -
 ** No Download - Do not Add to Cart ** As Clarity's Modern UX continues to evolve with each release, so has the transition conversation among Clarity Product Owners and Administrators. It's no longer a question of "if" and "when;" the question is, how? In this webinar, we'll explore some best practices that enable a successful shift from Classic to Modern. Through a collaborative discussion of overarching strategies to a step-by-step checklist, this session is designed to help you quickly position your users to take advantage of Clarity's latest and greatest capabilities. Nothing to Download - See Link below. http://info.regoconsulting.com/when-to-move-to-modernux-aug-2020
 -

Rego’s Clarity Adoption Metrics package consists of two sets of metrics: Project metrics, and Resource metrics. Project metrics measure how effectively project managers are using Clarity to manage their projects. Resource metrics measure how effectively resource managers are using Clarity to manage resources. Metrics are scored on a scale of 0 to 5, with higher scores indicating greater adoption and use. All metrics can be viewed numerically or graphically, and can be broken out by OBS. In addition, metric data can display as a 12-month rolling history to help identify trends. Project metrics can also display by lowest / highest adoption rates for a specific resource metric or all resource metrics. There is a variety of way to view the Adoption Metric data, therefore, Rego has made this simple by creating an Adoption Metrics object that contains multiple tabs. Each tab displays one or more of the Project or Resource Adoption Metrics. Based on the nature of the Metrics some tabs will allow the ability to use a pull down menu to select a specific Adoption Metric. There is also a Metrics trending view that pulls monthly snapshots of the metrics. Project metrics consist of the following: - Project Status Reporting – Measures how well PMs create and publish project status reports.
- Project Risk Adoption – Measures how well Risks are being used and managed.
- Project Issue Adoption – Measures how well Issues are being used and managed.
- Project Schedule – Measures how well PMs create tasks and keep the project schedule current.
- Project Baseline – Measures whether or not baselines exist.
- Project Zero ETC’s – Measures how well the PM assigns resources to tasks with ETCs.
- Project Past ETC’s – Measures how many improperly scheduled tasks the PM has.
- Project Milestone / Key Tasks – Measures how well PMs create and manage Milestones / Key Tasks.
- Project Schedule Variance – Measures how effectively PMs manage their schedules.
- Project Effort Variance – Measures how effectively PMs manage their project efforts.
- Project Budget Variance – Measures how effectively PMs manage budgets or cost plans.
- Project Unfilled Roles – Measures project roles with allocations that are already started or starting within the next 30 days.
- Project Data Quality – Measures how effectively PMs complete the Description, Stage, Progress, Objective, and Sponsor/Business Owner fields.
- Project Commitment – Measures the hard allocations for a project over a two week time frame.
- Resource Clarity Usage – Measures how often users log into Clarity.
- Resource Timesheet – Measures if timesheets post in a timely manner.
- Resource Allocation – Measures how well RMs keep total resource allocations within the expected range for future time periods.
- Resource Actualy Utilization – Measures how well Resource allocations match actuals.
- Resource Allocation Date in the Past – Measures how many resources are open for time entry with dates in the past.
- Resource Data Quality – Measures how well RMs complete the Resource Manager and Primary Role fields and optionally the Skill and Employment Type fields.
- Resource Commitment – Measures how much resource available time is committed to projects.
-
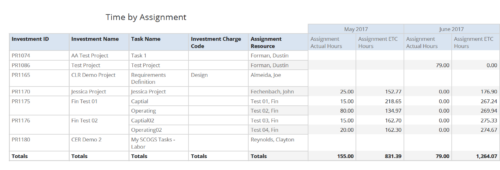 Time by Assignment report displays time logged to assignments and its associated actuals on monthly basis for all filtered investments. It also displays total ETC and Actual hours associated with an assignment. User can further narrow their search by OBS Type & Path, Investment Type, Investment Charge Code, Investment Name, Task Name, Resource Name, Assignment Start Date and Assignment Finish Date. User can use exact dates or relative dates for Assignment Start and Finish Dates filter parameters.
 -
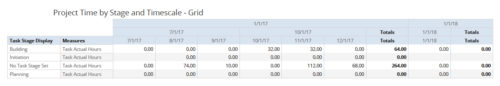 Time by Stage and Timescale – Grid report displays hours for all tasks on projects by their stage for a user-defined time period. Information can be drilled down to Year, Quarter or Monthly level. Using this report, Management can determine if excess time is being spent on a certain task stage within a project You can further narrow your search by Month Start Date, OBS Type & Path, Is Project Active? And Is Template?
 -
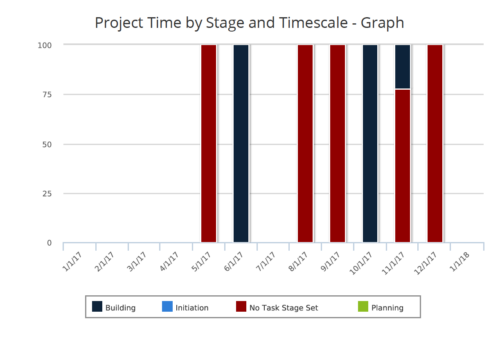 Time by Stage and Timescale – Graph report is a stacked column chart that displays hours for all tasks on projects by their stage for a user-defined time period. Using this report, Management can determine if excess time is being spent on a certain task stage within a project You can further narrow your search by Month Start Date, OBS Type & Path, Is Project Active? And Is Template?
 -
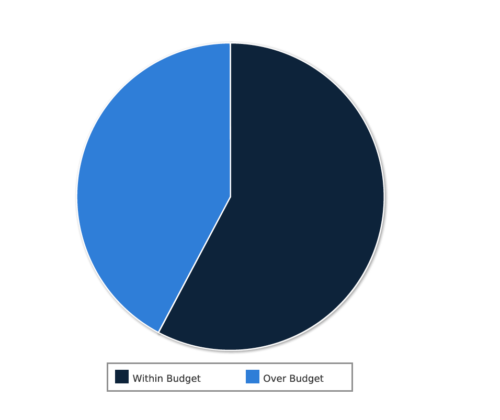 Project Cost within Budget report displays count of projects that are within or exceeding budget in the form of a pie chart. This report provides management a graphical representation of cost status on all projects. Mouse over on the pie chart displays count of projects for that category. You can further narrow your search by OBS Type & Path, Project Manager, Project Status, Project Stage, Program Name, Is project Active? And Is Template?.
 -
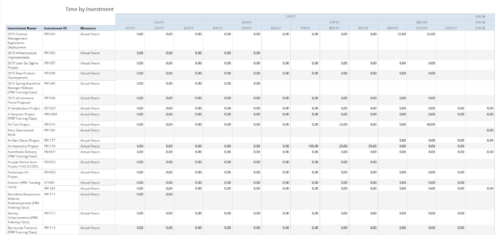 Time by Investment report displays time spent by resources on investment(s). User can view only the investments that he has access to view. Information can be drilled to Yearly, Quarterly or Monthly level. User can further narrow their search by OBS Type & Path, Investment Name, Month Start Date and Is Project Active?.
 -
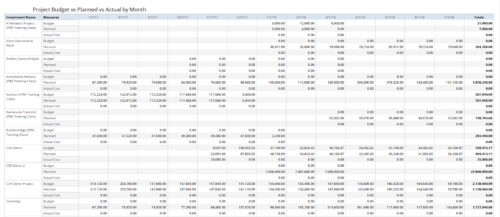 Project Budget vs Planned vs Actual by Month report provides the Project Managers a single place to view Project Budget, Planned and Actual Cost for multiple projects. Project Managers can use this view to compare various costs for that project in a particular month. User can further narrow their search by OBS Type & Path, Is Project Active?, Fiscal Month Start Date, Investment Manager and Investment Name.
 -
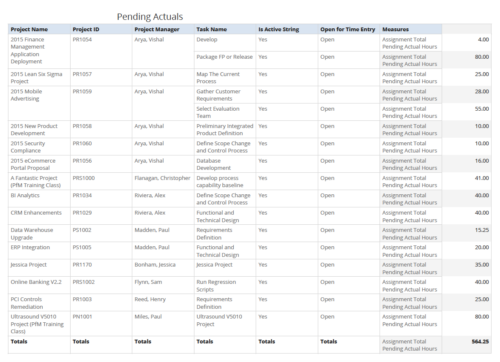 Pending Actuals report provides the Project Managers a single place to view all the pending actuals on tasks across multiple projects. User can view only the projects that he has access to. Managers can use this portlet to analyze the actuals that have been submitted but not posted on tasks. You can further narrow your search by OBS Type & Path and Assignment Total.
 -
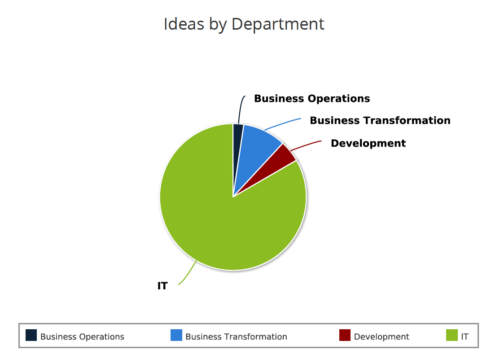 Ideas by Department report is a pie chart that displays count of ideas by department. Mouse over on the pie chart displays idea count for that department. You can further narrow your search by OBS Type & Path , Idea Status, Idea Start Date and Is Idea Active?.
 -
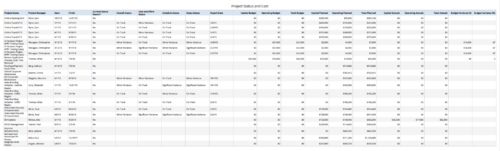 Project Status and Costs report gives the Project Manager a single place to view various Project Statuses ( Cost and Effort, Schedule, Scope and Overall ) and Costs ( Planned, Budget & Actuals ) for multiple projects. User can further narrow their search by OBS Type & Path, Project Name, Project Manager and Is Project Active?.
 -
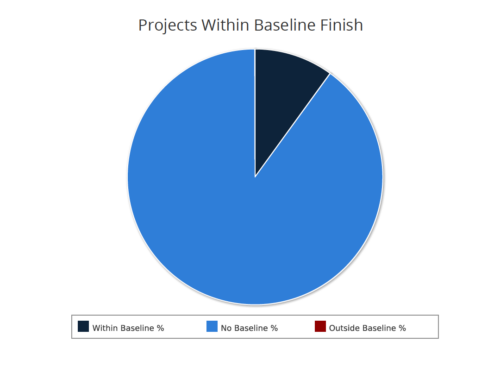 Projects within baseline finish report is a pie chart that displays projects that have a baseline or do not have a baseline. Projects with baseline are further segregated into within or outside baseline finish. Mouse over on the pie chart displays the % of projects within a particular category. You can further narrow your search by OBS Type & Path, Project Finish Date and Is Project Active?.
 -
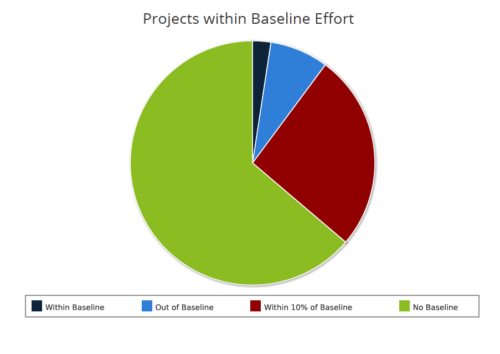 Projects within baseline effort report is a pie chart that displays projects baseline effort by their categories. Legend displays various baseline effort categories: Within Baseline, Out of Baseline, Within 10% Baseline and No Baseline. Mouse over on the pie chart displays the total number of projects within that particular category. You can further narrow your search by OBS Type & Path and Is Project Active?.
 -
 The Financial Summary by Transaction Class provides a visual graph for each year’s financial picture for multiple years. Report contains the following items: KPIs: Displays total benefit, capital, expense and net cash flow for the selected filter criteria Grid: Displays year wise break up of benefit, capital, expense and net cash flow for the selected filter criteria Graph: Benefit, capital, expense and net cash flow are depicted in graphical way for multiple years. This report will show the user where they need to concentrate their efforts in order to meet financial commitments. User can further narrow their search by OBS Type & Path.
 -
 Do you want to improve the success of your CA PPM projects? This class will discuss some lessons learned on making CA PPM projects more successful. We will discuss things like
- developing robust test plans, creating effective use and test cases, and implementing test scripts that make sense.
- why failures occur, and what you can do to minimize the impact and plan for success: case study in lessons learned.
- developing, testing, fine tuning, and executing deployment plans for success.
-
 Does project and idea estimation take too long and lack visibility? This class will address one of the most common pain points within organizations: how to involve the right people within a timely project estimate. Learn Rego’s model for defining, calculating, and modifying idea and project estimates, so you can increase throughput and ROI.
 -
 Are you struggling with implementing Agile tools in your organization in addition to CA PPM? This class will review best practices for implementing agile tools in conjunction with CA PPM - living in a Bi-Modal world. We will discuss how CA PPM can be used to govern both types of work and teams and how Agile tools should interface into CA PPM.
 -
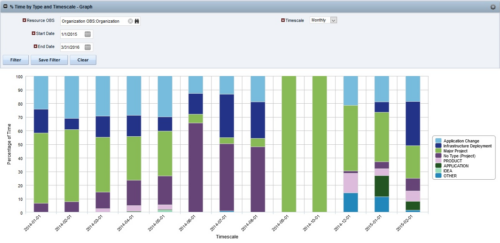
 The Percent Time by Type and Timescale - Graph portlet shows a breakout of time by timescale for resources the logged in user has view rights to. This portlet gives the Clarity user the ability to show the amount of hours spent on each project type by week, month, quarter and year. Using this portlet, the Clarity user can get an overview of all hours in a time period or use the filter to search for a specific dataset (as required). The portlet provides a filter for OBS and date ranges.
 -


The Percent Time by Type and Timescale - Grid portlet shows a breakout of time by timescale for resources the logged in user has view rights for using the timeslices. This portlet gives the Clarity user the ability to show the amount of hours spent on a project by week, month, quarter and year. Using this portlet, the Clarity user can get an overview of all hours in a time period or use the filter to search for a specific dataset (as required). The portlet provides a filter for OBS and date ranges. -
The Percent Time by Type and Timescale - Grid portlet shows a breakout of time by timescale for resources the logged in user has view rights for using the timeslices. This portlet gives the Clarity user the ability to show the amount of hours spent on a project by week, month, quarter and year. Using this portlet, the Clarity user can get an overview of all hours in a time period or use the filter to search for a specific dataset (as required). The portlet provides a filter for OBS and date ranges. -
The Percent Time by Type and Timescale - Grid portlet shows a breakout of time by timescale for resources the logged in user has view rights for using the timeslices. This portlet gives the Clarity user the ability to show the amount of hours spent on a project by week, month, quarter and year. Using this portlet, the Clarity user can get an overview of all hours in a time period or use the filter to search for a specific dataset (as required). The portlet provides a filter for OBS and date ranges.


Copyright 2023 • Rego Consulting Corporation • Privacy Policy