-
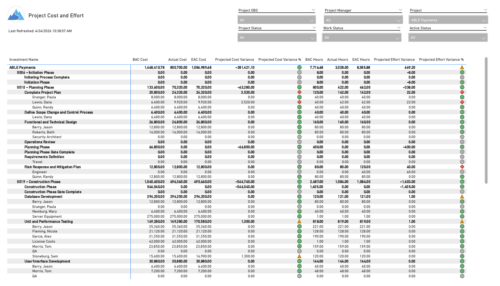 The Project Cost and Effort report provides a structured view of project financials and effort by outlining the work breakdown hierarchy, including any related subprojects. Users can choose to display information at varying levels of detail, such as project, phase, task, or assignment, depending on reporting needs. The report includes key metrics like baseline values, actuals, estimates at completion, and projected variances for both cost and effort. This enables stakeholders to analyze performance, monitor spending and workload, and gain insight into how projects are tracking against expectations.
 -
 The Key Tasks & Milestone Status report delivers comprehensive visibility into task and milestone performance through intuitive Start Date and Finish Date visualizations. It consolidates critical execution details, including task status, WBS type, and associated attributes such as project name, project manager, overall project status, and task completion percentage. The report supports dynamic filtering across multiple dimensions, including projects, OBS path, OBS type, task status, and WBS type, enabling targeted analysis and rapid insight. Interactive dashboards facilitate effective tracking, monitoring, and governance of tasks and milestones across the projects.
 -
 The Investment Issue Register report displays comprehensive information for each investment issue. The report only includes investments where the Risk, Issues, and Change modules are available. Report Prerequisites Verify that you have completed the following prerequisites before you run this report: • The investment must have at least one issue for the project to display in the report. • The issue properties must have fields such as description, category, resolution, target resolution, impact date, and originating ID completed for them to display data in the report. The issue name, issue ID, priority, status, and owner are required in Classic PPM so they always display data. • The Load Data Warehouse job must be run before you run this report. If the Data Warehouse is not populated, the report will not display any data. Also, most of the report parameters do not display options.
 -
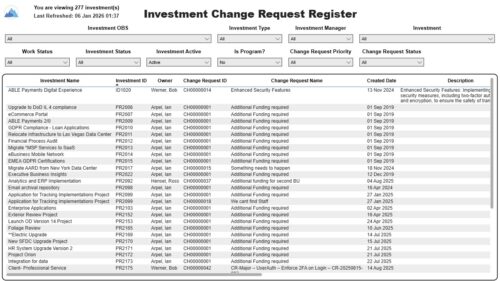 The Investment Change Request Register report displays comprehensive information for each investment change request. The report only includes investments where the Risk, Issues and Change modules are available. Report Prerequisites Verify that you have completed the following prerequisites before you run this report: • The investment must have at least one change request for the project to display in the report. • The change request properties must have fields such as description, change in cost, change in schedule, change in resources, category, expected close, approved by, approved date, and originating ID completed for them to display data in the report. The change request name, change request ID, priority, status, and owner are required in Classic PPM so they always display data. • The Load Data Warehouse job must be run before you run this report. If the Data Warehouse is not populated, the report will not display any data. Also, most of the report parameters do not display options.
 -
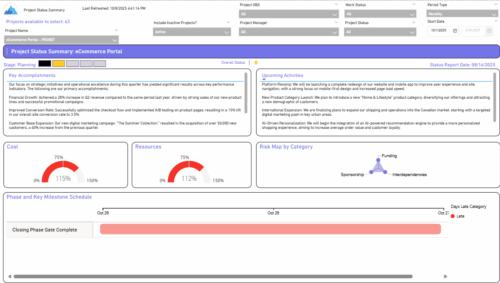 The Project Status Summary report highlights the overall health and progress of a project by summarizing key information such as current stage, status indicators, major accomplishments, upcoming activities, and resource and cost consumption. It also visualizes risk concentration across categories and includes a high-level Gantt chart showing major phases and milestones. This report provides a clear snapshot of project performance for quick executive or stakeholder review.
 -
 The Project Status Detail report provides a comprehensive view of each project’s key elements, including team allocations, major milestones, risks, issues, and change requests. It highlights the most relevant project indicators to give stakeholders a clear understanding of project health and progress. This report supports detailed tracking and review of project performance across multiple dimensions.
 -
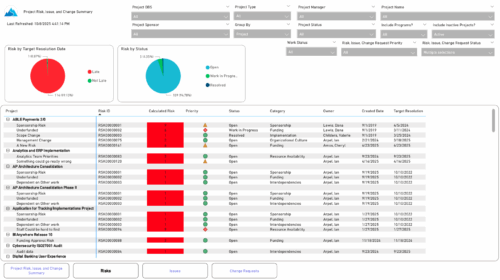 The Project Risk, Issue, and Change Summary report provides an overview of project health by visualizing risks, issues, and change requests. It includes pie charts that display counts by target resolution or expected close date, as well as by status. A detailed table lists each item’s name, ID, priority, status, category, owner, creation date, and resolution or close date. Results can be grouped by project or viewed without grouping to support flexible analysis and tracking.
 -
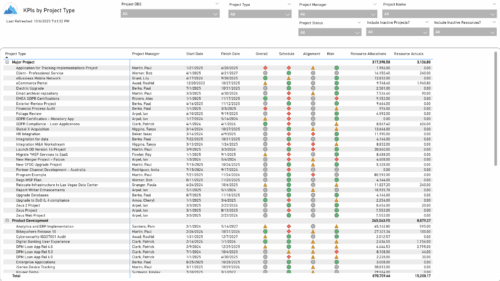 The KPIs by Project Type report provides a consolidated view of key performance indicators across projects, grouped by project type. It highlights metrics such as overall status, schedule, alignment, and risk, along with resource allocation and actual hours tracked since each project’s inception. This report enables quick comparison of performance trends and resource utilization across different project types.
 -
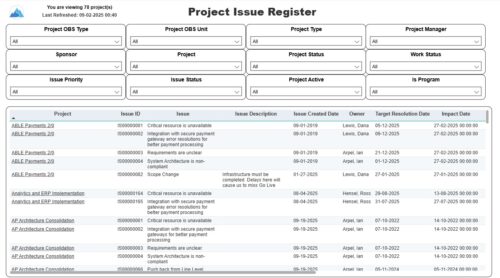 The Project Issue Register report displays comprehensive information for each project issue. The issue register also provides the option to display items that are associated to the issue such as notes, action items, and tasks. Report Prerequisites Verify that you have completed the following prerequisites before you run this report: • The project must have at least one issue for the project to display in the report. • The issue properties must have fields such as description, category, resolution, target resolution, impact date, and originating ID completed for them to display data in the report. The issue name, issue ID, priority, status, and owner are required in Classic PPM so they always display data.
 -
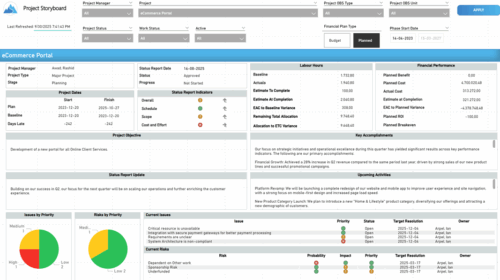 The Time Compliance report displays different frame in the displaying project information such as project dates, project objective, the amount, and cost of resources that are planned and actual, key accomplishments, upcoming activities, current issues and risks, and the project progress toward goals, and some EVM indicators for its phases.
 -
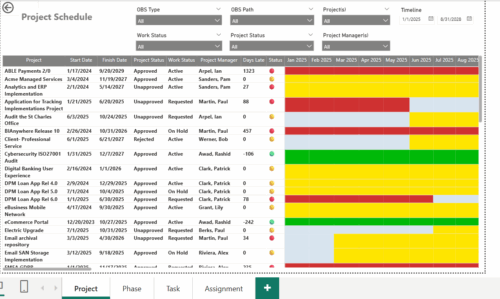 The Project Schedule report provides visibility into project schedule, including detailed information on days late, status and its associated items such as detailed info of schedule on Phase level, Task level and assignment level. Results are grouped by project in Phase, Task and assignment sections or can be viewed without grouping to support flexible analysis for projects. Interactive visuals make it easy to track, monitor, and manage schedule across projects.
 -
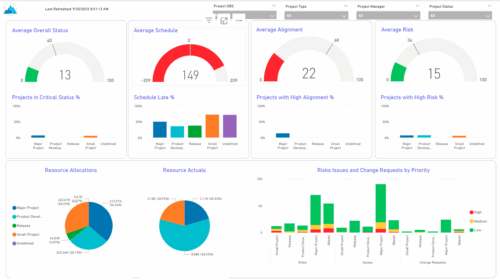 The KPIs by Project Type (Dashboard) report provides visibility into key project health measures, including status, schedule, alignment, and risk. Gauge visuals highlight each KPI at a summary level, while column charts break down results by project type. Resource allocation and actual hours are summarized in pie charts, making it easy to compare utilization across project types. In addition, bar charts display the number of issues, risks, and change requests by project type and priority, helping teams quickly identify areas of concern.
 -
 This session dives into the impact of misaligned data between planning and delivery systems—and what it costs your organization in rework, delays, and missed opportunities. Learn how connecting Clarity and Jira enables real-time synchronization between portfolio planning and Agile execution, giving CIOs the visibility, traceability, and confidence to drive outcomes—not just activity.
 -
 Aligning work to organizational strategy is a fundamental requirement in today's ever-changing marketplace. High performing organizations are moving beyond basic connections to introduce strategic hierarchies that are tied to real measurements of business value via Clarity's Objectives and Key Results (OKRs). Join our expert guides as they present key concepts, best practices, and the evolution of strategic alignment.
 -
 Value Stream Management (VSM) isn’t just another buzzword; it’s the visibility layer your digital transformation is starving for. In this session, learn how to map, measure, and maximize value across the entire delivery lifecycle.
 -
 Struggling to use an external scheduler like MS Project or Smartsheet with Clarity or investigating its potential? Learn how to effectively use these tools with Clarity in this training, which includes best practices and lessons learned. We will show both OOTB and Rego build connectors that will make the bidirectional connections seamless.
 -
 Nudge is a new tool developed by Rego to capture team sentiment in an anonymous, unobtrusive way, using micro surveys through MS Teams.
 -
 Want to boost Clarity adoption and data quality, all while having fun and keeping users engaged? Learn how gamification can benefit your organization in this exclusive demo. Check out features that reward users for desired behaviors, enable personalization, and offer fun ways to track project health through the animated world of Planimals.
 -
 Imagine responding to Clarity PPM workflow tasks (like timesheet approvals, budget reviews, and stage gate decisions) directly from your email. No login required, yet all conversations, decisions, and even context from attachments and images are automatically - and securely - captured in Clarity. Sound like a dream? Join this class to learn how to save time and increase adoption with this easy innovation.
 -
 The need to report and organize work around the Products continues to grow. Join this session to hear how Project and Product Management can thrive together in Clarity.
 -
 The Rego PowerBI Reporting Suite features close to 100 free PowerBI reports, designed to enhance project management and reporting capabilities.
 -
 The need for a dual operating model drives the need for a deliberate tooling architecture that will usually include a PPM / SPM and an Agile tool. Are you struggling with implementing Agile tools in your organization in addition to Clarity? This class will review best practices for implementing Agile tools in conjunction with Clarity - living in a Bi-Modal world. We will discuss how Clarity can be used to govern both types of work for teams, and how Agile tools should interface into Clarity.
 -
 This session will align you with best practices for using Clarity's project management functionality. Come and learn about the OOTB capabilities for excellent project management, including: scheduling, assignments, staffing, views, financial plans, and other general project management capabilities. Additionally, tips and tricks will be shared, providing you with a toolkit of ideas for your organization!
 -
 The Project Risk Register report provides visibility into project risks, including detailed information on each risk and its associated items such as notes, action items, tasks, and related risks or issues. Results can be grouped by project or viewed without grouping to support flexible analysis. Interactive visuals make it easy to track, monitor, and manage risks across projects.
 -
 Bringing back a classic topic with a modern update! Join this session to discuss tips and tricks for an optimized project manager experience in Clarity. This session is designed so attendees can share, collaborate, and benefit from their diverse experiences.
 -
 Bringing back a classic topic with a modern update! Join this session to discuss tips and tricks for an optimized PMO experience in Clarity. This session is designed so attendees can share, collaborate, and benefit from their diverse experiences.
 -
 London Stock Exchange shares their Clarity journey (since 2008) and where they want to take the tool next. Current goals are: • Moving toward standardized ways of working. Focused on connecting our ecosystem of tools with Clarity as a focal point for Portfolio Management and SPM. • With an end goal of Faster Time to Market, on a journey to be a Customer Lead organization.
 -
 Every chocolate bar starts as a cocoa bean, just like every project starts as an idea. Clarity was designed as the centralized process that transforms raw ideas into beautifully wrapped, ready-to-launch deliverables. It took a partnership across multiple divisions to ensure success!
 -
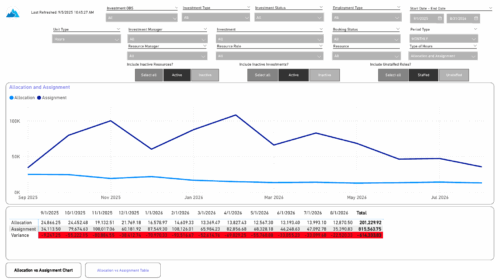 The Investment Allocations and Assignments report provides visibility into team member allocation, task assignment, and variance amounts by investment across time periods. A chart highlights allocation compared to assignment amounts by period. Results can be displayed by week, month, or in total, and viewed in either hours or FTEs for each team member and investment. Interactive visuals make it easy to compare planned effort against actual assignments at the team member and investment level. Content Type: Business Intelligence, PowerBI Report
 -
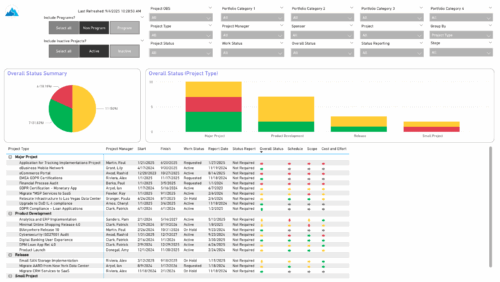 The Project Status Report List provides a consolidated view of project health, including schedule dates, work status, and key status indicators. Users can group results by Portfolio Category, Overall Status, Project Type, Stage, Project Manager, Sponsor, or OBS Level, with the report dynamically adjusting its columns based on the grouping selected. Visuals include an overall status pie chart that shows the percentage of projects by status color, and a column chart that breaks down project counts by status, aligned to the chosen grouping option.
 -
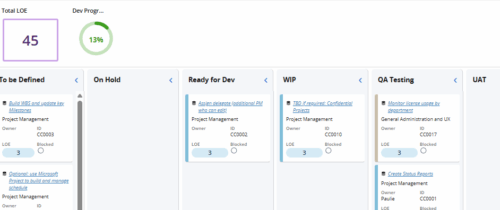 Leverage a Kanban or Sprint approach to manage Clarity Implementation and ongoing improvements. List also serves as a history of configuration changes, reasons, and deployment dates.
 -
 This training document is a Rego Consulting Quick Reference Guide to assist with the management of project Financials in Clarity’s Modern User Experience. This doc references version 16.3 views. Document includes summary information on the Financials module and provides detail on how to customize the grid and save views. Instructions are provided on how to filter data and how to use the ⋮ (vertical ellipses) icon to access further features. Detail is provided on the group by function, the column panel, the export of cost plan and editing cost plan and budget plan data from the grid.
 -
This training document is a Rego Consulting Quick Reference Guide to assist with the creation and editing of Tasks in the Timeline View of Clarity’s Modern User Experience. This doc references version 16.3 views. Doc covers how to create a new task in the Timeline View, how to insert sibling or insert child tasks, how to set Milestones, access the Details pane and add resource Assignments. Also details how to move tasks by clicking and dragging within the Timeline View.
-
This training document is a Rego Consulting Quick Reference Guide to assist with the management of Project Tasks via the PPM Gantt view in Clarity’s Modern User Experience. This doc references version 16.3 views. Doc covers PPM Gantt, View Legend, Menu Icons, Create New Task, Indent Tasks, Move Tasks and Set Dependencies.
-
This training document is a Rego Consulting Quick Reference Guide to assist with the creation of Status Reports in Clarity’s Modern User Experience. This doc references version 16.3 views. Document covers the creation of Status Reports via the Status Module as well as the Status Report Module. Detail is provided on the widgets that can be used within the Status Report canvas as well as instructions on how to configure the canvas. Detail is also provided on how to Preview and Publish status reports.
-
This training document is a Rego Consulting Quick Reference Guide to assist with the staffing of a Team on an investment in Clarity’s Modern User Experience. This doc references version 16.3 views. Doc covers Common Terms, setting up a Default Allocation, Allocation vs ETC, Staff Tab, and Staffing the Team – Time Scale.


Copyright 2023 • Rego Consulting Corporation • Privacy Policy