
KPIs by Project Type (Dashboard) (Power BI)
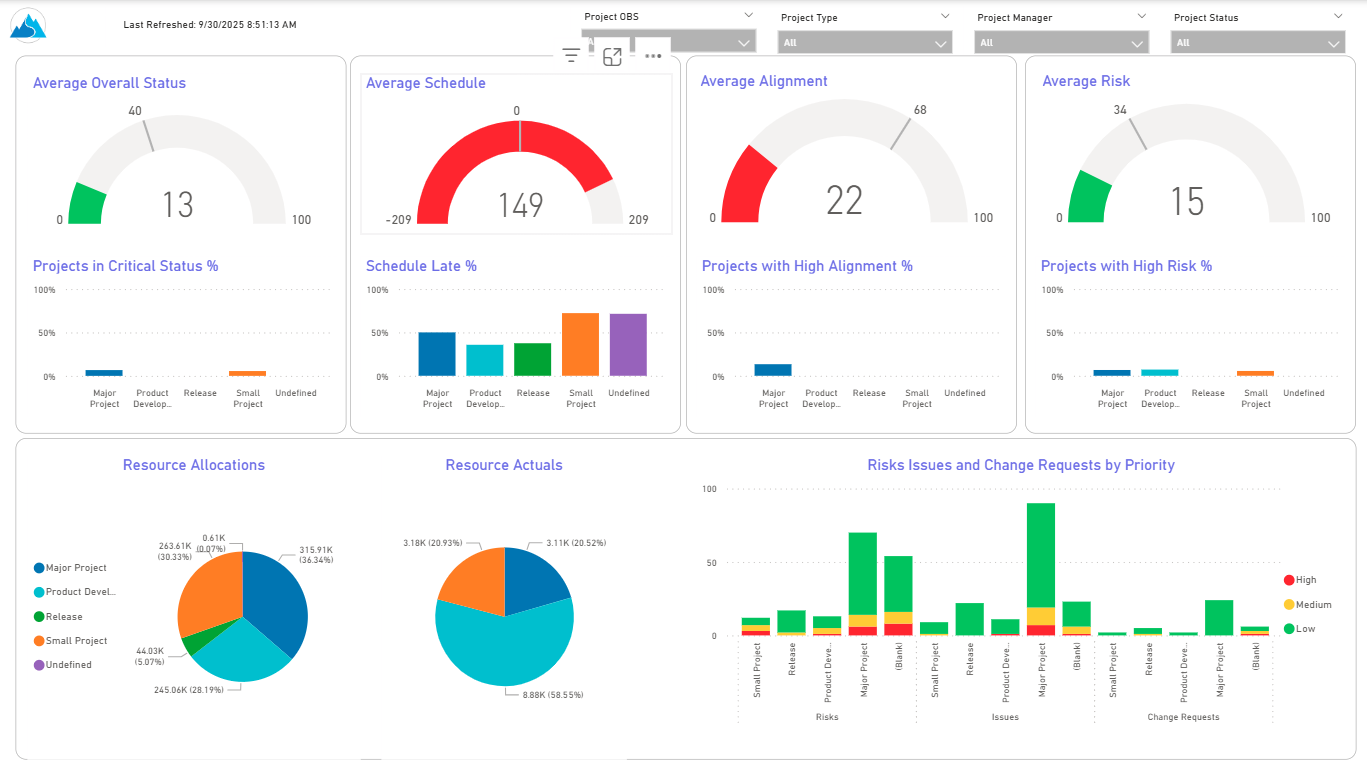
The KPIs by Project Type (Dashboard) report provides visibility into key project health measures, including status, schedule, alignment, and risk. Gauge visuals highlight each KPI at a summary level, while column charts break down results by project type. Resource allocation and actual hours are summarized in pie charts, making it easy to compare utilization across project types. In addition, bar charts display the number of issues, risks, and change requests by project type and priority, helping teams quickly identify areas of concern.
Download Details
RegoXchange Content ID: EX2788
Submission Date: 10/3/2025
Submitter:
Content Type: Business Intelligence
Related Modules: Project Management
Company: Rego Consulting
Version Support
Versions Supported: v16.3.3+
Special Instructions
Special Instructions: See RegoXchange item #EX1565 – “Using RegoXchange Power BI Reports – How to Update the Data Source” for more details on implementing this report.
