-
 Course Description: “For clients that have both ServiceNow and CA PPM, passing information between the systems becomes vital for the enterprise with both ITSM and PPM toolsets. One of the biggest areas of interaction is around Demand Management. Come and see Rego's Integration solution which flexibly allows for ServiceNow records (Incident, Problem, Idea, Enhancement, and Demands) to generate CA PPM Ideas or Projects. This lets you control where you want to perform Demand Management, and the work lands in CA PPM's Project either way.” Download is the slide deck used for the presentation.
 -
 Course Description: A review of the basics around APM. Covering Business Capabilities, Application Scoring, and Best Practices.
 -
 By its very nature, the shift to Product Funding is going to require that tracking of that funding. Agile tools do not have much, if any, financial capabilities, so it is important to create an eco-system that can support this value stream—from funding, through delivery, and finally to tracking the realization of financial value. Learn how Rally and Clarity PPM do this very well together.
 -
 Funnel Chart displays aggregated counts of Ideas by “Idea Progress”, a custom attribute. Chart shows Idea Progress names in legend, and count total is available as a mouse-over. No filters available on this portlet.
 -
 The Capacity Graph - Investment portlet displays Availability, Allocations, Assignments and Actuals for active resources in a single project. This portlet pulls from timeslices and allows the user to filter on weekly, monthly, or quarterly data. This portlet provides a Project Manager with a simple way to analyse: Allocations vs. Actuals and Allocations vs. ETC. Depending on metric goals, the graph allows the user to determine where areas of improvement may exist.
 -
 The All Issues portlet displays all Issues related to active projects that the logged in user has view rights to. The portlet provides the project manager a single place to view issues across multiple projects without having to go into each project individually, and allows for more efficient management and reporting across projects. The filter then allows the user to narrow their search by Issue ID, Issue Name, Project ID, Project Name, the individual to whom the issue is assigned, and Issue Status. You may also narrow the view to display issues with a target resolution date within a certain date range, or Issues associated with a particular Category or OBS unit. Note: Only the projects that the user has viewer rights to will show up in the list.
 -
 Every chocolate bar starts as a cocoa bean, just like every project starts as an idea. Clarity was designed as the centralized process that transforms raw ideas into beautifully wrapped, ready-to-launch deliverables. It took a partnership across multiple divisions to ensure success!
 -
 Are you starting a demand/portfolio management implementation, or do you want to compare how you are using these functions vs. others or best practices? In this class we will discuss some best practices from successful customers.
 -
 Course Description: This session will walk you through a step-by-step approach to doing application rationalization within your organization. We will also review how to sell the benefits and processes within your organization.
 -
 This training document is a Rego Consulting Quick Reference Guide to assist with Idea approval and conversion to projects in Clarity’s Modern User Experience. This doc references version 16.1 views. Doc reviews setting Ideas as Approved and converting Ideas to projects.
 -

 “Rego Health Check” is a UI Friendly, Clarity Studio created add-in that allows environment administrators to create configurations which can be executed on a recurring basis to ensure the environment is running optimally. It allows the Clarity admin to run an Infrastructure Health Check and Status Summary, Application Health Check, and Business-related Checks. This is a RegoLink product that is available for purchase. The download materials provide more information on this product. Contact your Rego Account Director for more information.
 -
 Change is constant in an organization, and each change is more than just a one-time event. This session will talk about keys to successfully sustaining change adoption vs. just implementing change in your organization.
 -
 Part of the Business Transformation Content collection, this bar chart portlet displays count of ideas per business unit. This provides a holistic view of the idea pipe-line in an organization providing them a high-level of ideas converted, approved, unapproved per business unit.
 -
 Part of the Business Transformation collection, this grid portlet displays idea details for all ideas (active and inactive) and all status conditions. This is an editable portlet based on the Ideas data provider. Filterable by OBS structure, Active/Inactive, and Status.
 -
 Do you want to report on TCO for your organization by business function, application, or service? This should be the financial management goal of every organization. This class will discuss a path and some architecture choices to make this a reality. We will highlight want some customers are doing today and share some best practices on the journey.
 -
 Course Description: How do companies track stage gates within Clarity PPM? This session will review some best practices for tracking, monitoring, and approving stage gates within Clarity PPM. We will also discuss pros and cons of various options to help you select the best method for your company.
 -
 This training document is a Rego Consulting Quick Reference Guide to assist with General Navigation in Clarity’s Modern User Experience. This doc references version 16.1 views. Doc reviews the Menu Bar and User Tool Bar. Document provides instructions on how to access blueprints, create a new blueprint and edit the fields available on the blueprint. Detail is also provided on how to update the modules, rules and actions associated with a blueprint. Instructions are listed to show the user how to modify the create from template page, how to add a new channel and how to set a default blueprint. Tips on the user of the API Attribute ID are also provided.
 -
 This training document is a Rego Consulting Quick Reference Guide to assist with General Navigation in Clarity’s Modern User Experience. This doc references version 16.1 views. Doc reviews the Menu Bar and User Tool Bar.
 -
The Capacity Graph - Investment portlet displays Availability, Allocations, Assignments and Actuals for active resources in a single project. This portlet pulls from timeslices and allows the user to filter on weekly, monthly, or quarterly data. This portlet provides a Project Manager with a simple way to analyse: Allocations vs. Actuals and Allocations vs. ETC. Depending on metric goals, the graph allows the user to determine where areas of improvement may exist.
-
 How do you address ever-growing backlogs and impatient demands from internal or external customers, while also balancing the desire to innovate with the need to maintain high performance and quality? This session focuses on proven techniques - learned over several years and iterations - to help win the battle against these challenges.
 -
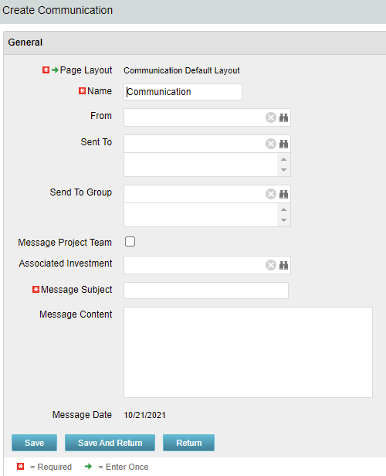 The Communications Object allows a user to send an html-based email to all users on a project, in a security group, or to individual users directly from Clarity. An email can be sent by creating a new entry on the Communication List page, upon saving a new entry the email process with trigger and send the email. Auto Start Solution: An email can be sent by creating a new entry on the Communication List page, upon saving a new entry the email process with trigger. On Demand Solution: All emails could be sent together as a broadcast communication by running the process manually from the Organizer. This process could also be scheduled to run on a specific time using Jobs The table below describes the available columns on the object.
Either of the on-demand process or auto start process should be active at a time. The package provides two Processes: 1. Send Notification (ID:rego_send_notification) This is an auto start process. The notification is sent immediately when a new entry is created on the Communication object. Only one email notification will be sent for one entry. Any updates to the same entry will not trigger any new notifications. 2. Email Communication (ID:rego_email_comm) This is an on-demand process that could be run from the Organizer. This send notification to all the entries on the Communication objects for which a communication was not already sent. This process does not have a Primary object. The processes are designed to work both in Oracle and Postgres environment. If the DB vendor information from Properties.xml is Postgres the SQL query for Postgres will be called. If not, the default SQL is Oracle. Important Note: Either of the processes should be active for an Implementation. If both the processes are active the on-demand process has no effect and will never send any communication. All object entries have a sent flag which will be marked whenever a notification is sent. Both the processes set the same flag on the object instance. Only with admin DB rights this flag could be overwritten. Object Name:Communication Object ID: rego_communication Flag Attribute Name: Sent (Id: rego_sent)Column Label Description From Who the email is coming from Sent To Individual users the message should send to Send to Group Security groups the message should send to (users within the security groups) Message Project Team Should this message be sent to a project team Associated Investment If Message Project Team is checked, which project should the team list be pulled from Message Subject Subject line of the email Message Content Body of the email (html) Message date Internal code used by the query -
 This portlet pulls back the Availability and Allocation totals by Role between a user-specified Start and Finish Date, then the user can drilldown to look at the information for Applications. The Time Period filter allows for comparing these values across different timeframes (monthly, weekly, quarterly, annual) as desired. Other filters allow for looking at Active or Inactive Roles (or both) and including Active or Inactive Projects (or both) in the totals.
 -
 Course description: “Are you an NPD CA PPM user? This session is dedicated to NPD users to discuss some of the unique requirements and configurations needed to support project management for new product development.” Download file is the slide deck used for the presentation.
 -
 Course description: “What can leaders do after a CA PPM deployment to ensure continued success of the product? This session will discuss how sponsors can drive compliance within the organization through continued involvement. Strong sponsorship is the key to long term success.” Download file is the slide deck used during the presentation.
 -
 Course Description: Do some folks in your organization view Clarity PPM as worthless or of little value? In this class, we will discuss how to increase the value perception of Clarity PPM and innovative ways to sell the value Clarity PPM provides to stakeholders and users.
 -
Funnel Chart displays aggregated counts of Ideas by “Idea Progress”, a custom attribute. Chart shows Idea Progress names in legend, and count total is available as a mouse-over. No filters available on this portlet.
-
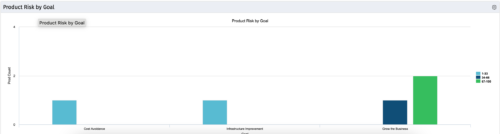 The Product Risk by Goal portlet displays a count of active products by goal with a sub-count by risk. The graph is color-coded by risk rating:
- 1-33 – Green
- 34-66 – Yellow
- 67-100 – Red
-
 The Application Cost by Year portlet displays the active application cost by year, summarized by goal. The application cost is pulled from the application's planned cost and is displayed by year, with colors representing each application goal. This portlet provides management with a quick overview of all application costs without having to navigate to each application individually.
 -
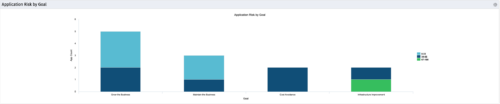 The Application Risk by Goal portlet displays a count of active applications by goal with a sub-count by risk. The graph is color-coded by risk rating:
- 1-33 – Green
- 34-66 – Yellow
- 67-100 – Red
-
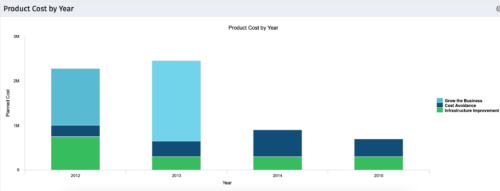 The Product Cost by Year portlet displays active product cost by year, summarized by goal. The product cost is pulled from the product’s planned cost and is displayed by year, with colors representing each product goal. This portlet provides management with a quick overview of all product costs without having to navigate to each product individually.
 -
 This training document is a Rego Consulting Quick Reference Guide to assist with the management of Custom Investment Types in Clarity’s Modern User Experience. This doc references version 16.1 views. Document provides detail on how to create a Custom Investment Type and how to create Custom Investment records from the Grid View and the Board View.
 -
Part of the Business Transformation Content collection, this bar chart portlet displays count of ideas per business unit. This provides a holistic view of the idea pipe-line in an organization providing them a high-level of ideas converted, approved, unapproved per business unit.
-
Part of the Business Transformation Content collection, this bar chart portlet displays count of ideas per business unit. This provides a holistic view of the idea pipe-line in an organization providing them a high-level of ideas converted, approved, unapproved per business unit.
-
This portlet pulls back the Availability and Allocation totals by Role between a user-specified Start and Finish Date, then the user can drilldown to look at the information for Applications. The Time Period filter allows for comparing these values across different timeframes (monthly, weekly, quarterly, annual) as desired. Other filters allow for looking at Active or Inactive Roles (or both) and including Active or Inactive Projects (or both) in the totals.
-
Part of the Business Transformation collection, this grid portlet displays idea details for all ideas (active and inactive) and all status conditions. This is an editable portlet based on the Ideas data provider. Filterable by OBS structure, Active/Inactive, and Status.
-
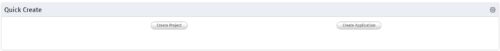 An HTML portlet that displays two buttons that link the user instantly to an object create page. The portlet comes with two buttons and the buttons can be modified to link to any creation page. Administrator can choose: Project, Idea, Application, Program, etc.


Copyright 2023 • Rego Consulting Corporation • Privacy Policy