-
 This training document is a Rego Consulting Quick Reference Guide to assist with management of Custom Investments in Clarity’s Modern User Experience. The document reviews navigation to a custom investment and then the various tabs related to the management of the investment.
 -
 This training document is a Rego Consulting Quick Reference Guide to assist with creating Custom Investments in Clarity’s Modern User Experience. The document reviews creating a Custom Investment Type and creating a Custom Investment Record.
 -
 A Quick Reference Guide to assist in the process of converting a Idea into an Investment in Clarity. Includes information on adding financial and resource data into the new investment.
 -
 A Quick Reference Guide to assist in configuring the layout of Ideas and Custom Investments in Clarity’s Modern UX via Blueprints. Reviews the configuration process including changes to Details and Modules.
 -
 Course description: “People are the #1 key to successful implementation, acceptance and sustaining adoption after the project is long gone. Find out some tips and tricks on how to keep those key stakeholders engaged.” Download file is the presentation slide deck.
 -
 A .pdf file that has the slide by slide presentation at 2015 RegoU on enhancing CA PPM performance with a review of root causes and quick solutions.
 -
 A .pdf file that has the slide by slide presentation at 2015 RegoU on how other companies are using CA PPM. The agenda covers an overview, definitions, business value, key requirements and best practices.
 -
 Course description: “Are you an NPD CA PPM user? This session is dedicated to NPD users to discuss some of the unique requirements and configurations needed to support project management for new product development.” Download file is the slide deck used for the presentation.
 -
 Course description: “What can leaders do after a CA PPM deployment to ensure continued success of the product? This session will discuss how sponsors can drive compliance within the organization through continued involvement. Strong sponsorship is the key to long term success.” Download file is the slide deck used during the presentation.
 -
 Course Description: “For clients that have both ServiceNow and CA PPM, passing information between the systems becomes vital for the enterprise with both ITSM and PPM toolsets. One of the biggest areas of interaction is around Demand Management. Come and see Rego's Integration solution which flexibly allows for ServiceNow records (Incident, Problem, Idea, Enhancement, and Demands) to generate CA PPM Ideas or Projects. This lets you control where you want to perform Demand Management, and the work lands in CA PPM's Project either way.” Download is the slide deck used for the presentation.
 -
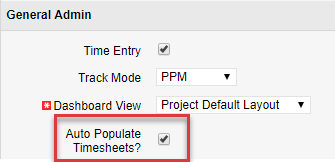
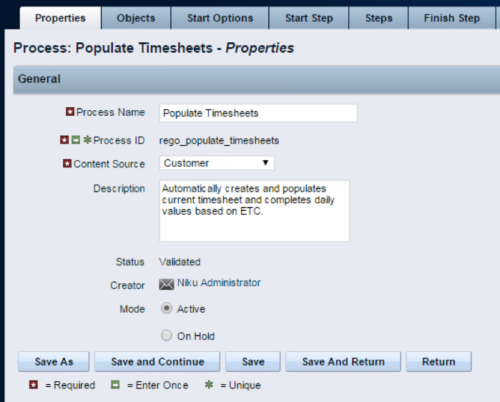 The Populate Timesheets process converts task level ETC into time entered on the timesheet. The process relies on the resource “opting in” to the process by checking a new attribute called “Auto Populate Timesheet?”, as well as the project manager “opting in” at the project level via a new attribute called “Auto Populate Timesheet?” Once the resource opts in and the PM opts in, the process will create a timesheet for the resource, pulling in the ETCs for the tasks that week and moving them to the actual hours. Once the process runs, an email will be sent to the resource letting them know the hours have been applied.
 -
The Populate Timesheets process converts task level ETC into time entered on the timesheet. The process relies on the resource “opting in” to the process by checking a new attribute called “Auto Populate Timesheet?”, as well as the project manager “opting in” at the project level via a new attribute called “Auto Populate Timesheet?” Once the resource opts in and the PM opts in, the process will create a timesheet for the resource, pulling in the ETCs for the tasks that week and moving them to the actual hours. Once the process runs, an email will be sent to the resource letting them know the hours have been applied.
-
 Do you want to report on TCO for your organization by business function, application, or service? This should be the financial management goal of every organization. This class will discuss a path and some architecture choices to make this a reality. We will highlight want some customers are doing today and share some best practices on the journey.
 -
 Do you want to add interfaces to your CA PPM instance? This class will review the pros and cons of various integration methods and provide best practice on how to handle various interfaces. We’ll walk you through specific interface examples and showcase Rego’s pre-built interface sets you can leverage to reduce the time and cost of implementation.
 -
 Are you starting a demand/portfolio management implementation, or do you want to compare how you are using these functions vs. others or best practices? In this class we will discuss some best practices from successful customers.
 -
 Course Description: This session will walk you through a step-by-step approach to doing application rationalization within your organization. We will also review how to sell the benefits and processes within your organization.
 -
 Course Description: How do companies track stage gates within Clarity PPM? This session will review some best practices for tracking, monitoring, and approving stage gates within Clarity PPM. We will also discuss pros and cons of various options to help you select the best method for your company.
 -
 Course Description: For clients that have both ServiceNow and Clarity PPM, passing information between the systems becomes vital for the enterprise with ITSM, demand, and PPM toolsets. One of the biggest areas of interaction is around demand management. Come and see Rego's integration solution, which flexibly allows for ServiceNow records (incident, problem, idea, enhancement, and demands) to generate Clarity PPM ideas or projects.
 -
 Course Description: Do some folks in your organization view Clarity PPM as worthless or of little value? In this class, we will discuss how to increase the value perception of Clarity PPM and innovative ways to sell the value Clarity PPM provides to stakeholders and users.
 -
 Course Description: Does your organization struggle to understand your fully burdened TCO for the applications that enable your business? Do you use spreadsheets and disparate data sources to manually calculate TCO? This session explores the data sources needed to calculate the fully burdened TCO for applications. We will also cover marketplace tools that allow you to track spending, providing trends of applications broken down by run and development costs.
 -
 Course Description: Do you know what PPM, APM, Agile, ITFM, and other tools are available in the marketplace? Have you taken a strategic look at the key IT processes and tools that exist to support them? Have you been asked to evaluate and recommend a PPM tool? This class will review other ITBM tools and examine their pros and cons. We will also provide six keys to evaluating a PPM solution.
 -
 Course Description: A review of the basics around APM. Covering Business Capabilities, Application Scoring, and Best Practices.
 -
 Course Description: Does your organization want to implement application portfolio management (APM)? Are you trying to determine the value in implementing APM? Are you struggling to know what tool you should use and what data is important to collect? This session will review specific use cases of companies that have implemented APM and effectively used the data to drive value for the organization.
 -
 By its very nature, the shift to Product Funding is going to require that tracking of that funding. Agile tools do not have much, if any, financial capabilities, so it is important to create an eco-system that can support this value stream—from funding, through delivery, and finally to tracking the realization of financial value. Learn how Rally and Clarity PPM do this very well together.
 -
 Have you looked in the regoXchange or reviewed Rego’s innovation offerings? This class will show you the power of Rego’s pre-built content library, integrations, and other assets. See example after example of portlets, processes, and materials you can use to add value to your instance of Clarity. Learn how you can introduce email-based approvals with Rego's action item responder. Get a peek at Rego's new MSP integration that avoids the issues faced with the OOTB integration. Finally, understand Rego's pre-built connectors and how they can benefit your instance. Including blueprint migrator. Include free tools like GEL builder, query, XOGbridge.
 -
 Funnel Chart displays aggregated counts of Ideas by “Idea Progress”, a custom attribute. Chart shows Idea Progress names in legend, and count total is available as a mouse-over. No filters available on this portlet.
 -
Funnel Chart displays aggregated counts of Ideas by “Idea Progress”, a custom attribute. Chart shows Idea Progress names in legend, and count total is available as a mouse-over. No filters available on this portlet.
-
Funnel Chart displays aggregated counts of Ideas by “Idea Progress”, a custom attribute. Chart shows Idea Progress names in legend, and count total is available as a mouse-over. No filters available on this portlet.
-
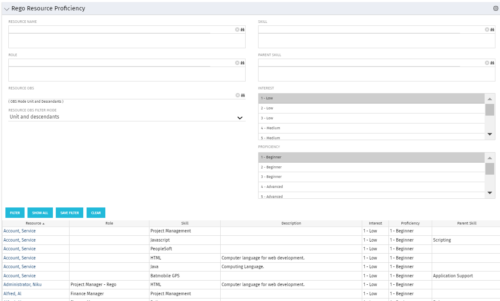 This grid displays Skill Proficiency and Interest Level by Resource. Users can utilize this view to search for Resources by Skill, Parent Skill, Interest, Role, Parent Role, Resource and Resource OBS. This portlet grants a Project Manager or Resource Manager the ability to determine which Resources best fit the needs for their project.
 -
This grid displays Skill Proficiency and Interest Level by Resource. Users can utilize this view to search for Resources by Skill, Parent Skill, Interest, Role, Parent Role, Resource and Resource OBS. This portlet grants a Project Manager or Resource Manager the ability to determine which Resources best fit the needs for their project.
-
 Pie Chart displays total Ideas by Priority, filterable by Active / Inactive and by OBS structure. Data Label and Mouse-over label display counts by Priority. Legend shows Priority Name. Chart also shows Ideas with No Priority.
 -
 Pie Chart displays count of all Ideas by Department. Filterable by Active and Inactive, by OBS, and by Department Manager. Data label and mouse-over show department counts. Legend displays department names.
 -
Pie Chart displays count of all Ideas by Department. Filterable by Active and Inactive, by OBS, and by Department Manager. Data label and mouse-over show department counts. Legend displays department names.
-
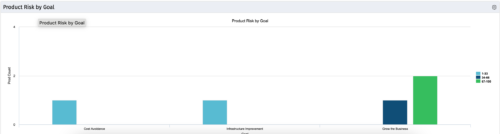 The Product Risk by Goal portlet displays a count of active products by goal with a sub-count by risk. The graph is color-coded by risk rating:
- 1-33 – Green
- 34-66 – Yellow
- 67-100 – Red
-
The Product Risk by Goal portlet displays a count of active products by goal with a sub-count by risk. The graph is color-coded by risk rating:
- 1-33 – Green
- 34-66 – Yellow
- 67-100 – Red


Copyright 2023 • Rego Consulting Corporation • Privacy Policy