-
 The Auto-Approve Old Timesheets workflow process can be run through the "Execute a Process" job and may be used to quickly close out timesheets for a specified timeframe for period closure. The workflow will execute a query that will automatically approve ALL (no matter the status of the timesheet) timesheets that have a time period start date before the Approve Date specified within the process itself.
 -
The Auto-Approve Old Timesheets workflow process can be run through the "Execute a Process" job and may be used to quickly close out timesheets for a specified timeframe for period closure. The workflow will execute a query that will automatically approve ALL (no matter the status of the timesheet) timesheets that have a time period start date before the Approve Date specified within the process itself.
-
 Has your organization made significant investments in technology solutions without seeing precise results? Do you have the right capabilities yet lack a vibrant and interconnected end-to-end solution? Come to this session to learn more about the importance of a living strategic roadmap and how Rego's Digital Ecosystem Assessment program can help. This session will review the key elements needed to create an effective roadmap that can help optimize your digital ecosystem, drive increased maturity, and increase engagement within your organization.
 -
 Looking to automate some tasks within your Clarity environment? This class will guide you through Clarity's workflow engine, covering instance vs. general processes, start options, action types, pre and post conditions, MUX workflows, and notifications.
 -
 This course will introduce fundamental programming concepts like variable assignment, conditional statements, and loops. The class will be taught in GEL and will build a solid foundation for future programming skills.
 -
 This introductory course will teach students how to query the Clarity database using SQL. We will discuss different methods to query the database, the basics of SQL, and the Clarity data model.
 -
 Demystify GEL scripts and learn best practices for GEL script development and maintenance. We'll discuss code formatting, comments, pros and cons of various GEL tags, and any other topics that have been on your mind. With several instructors we can break into smaller groups to ensure we answer all of your specific questions including advanced use cases like notifications, querying the database, etc.
 -
 In this course we'll go beyond the basics of SQL and focus on writing clean, efficient, and scalable queries. We'll cover industry-standard best practices for structuring SQL code, optimizing performance, using functions, and working with large datasets in a maintainable way.
 -
 This round table discussion will focus on Clarity configurations using Studio. A well-configured Clarity environment will minimize performance bottlenecks, ease development, and increase end user adoption. Join us to discuss best practices around object structure, naming conventions, audit trail settings, and more.
 -
 Value Stream Management (VSM) isn’t just another buzzword; it’s the visibility layer your digital transformation is starving for. In this session, learn how to map, measure, and maximize value across the entire delivery lifecycle.
 -

- Introduction to Power BI and its components
- Getting Data
- Mockup – PM and RM Dashboard
- Publishing and Sharing
- Best practices and its limitations
- Tableau Introduction
-
 A Quick Reference Guide to assist in the use of Blueprints/Channels to access external sites, applications or Classic PPM in the Modern UX of Clarity. Reviews the configuraton process.
 -
 A Quck Reference Guide to assist in the application of Field Level Security for Groups in Clarity’s Modern UX. Reviews the process of applying security to specific fields for specific groups.
 -
 A Quick Reference Guide to assist in configuring the layout of Ideas and Custom Investments in Clarity’s Modern UX via Blueprints. Reviews the configuration process including changes to Details and Modules.
 -
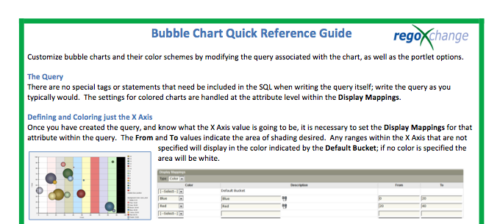 The Bubble Chart Quick Reference Guide provides the user instructions to customize bubble charts and their color schemes by modifying the query associated with the chart, as well as the portlet options. This is very beneficial as it allows the user to match or blend colors among all of the bubble portlets to better display the information the portlets are delivering. Similar data can be one color while different data can be its own color to better show the overall picture.
 -
The Bubble Chart Quick Reference Guide provides the user instructions to customize bubble charts and their color schemes by modifying the query associated with the chart, as well as the portlet options. This is very beneficial as it allows the user to match or blend colors among all of the bubble portlets to better display the information the portlets are delivering. Similar data can be one color while different data can be its own color to better show the overall picture.
-
 Learn how to discover business processes and automation patterns, using new technology from ConnectALL to power your Value Stream Management. The key is to understand and map automation patterns that both enables new business and accelerates adoption of ValueOps
 -
 Do you want to know more about building integrations using CA PPM's web services? This session will be a hands-on lab to build a web service-based integration and discuss situations where other web services can be used.
 -
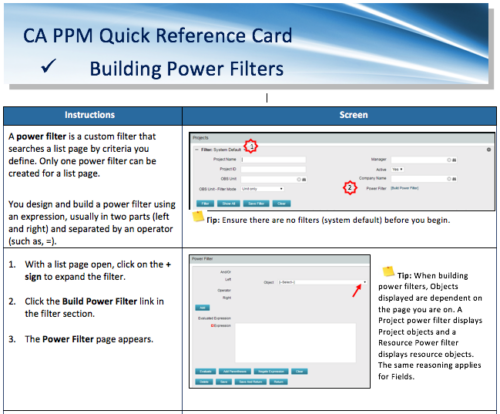 A Quick Reference Card to assist in the building of Power Filters in CA PPM. A power filter is a custom filter that searches a list page by criteria you define. Only one power filter can be created for a list page.
 -
 Are you struggling with implementing Agile tools in your organization in addition to CA PPM? This class will review best practices for implementing agile tools in conjunction with CA PPM - living in a Bi-Modal world. We will discuss how CA PPM can be used to govern both types of work and teams and how Agile tools should interface into CA PPM.
 -
 Course Description: “For clients that have both ServiceNow and CA PPM, passing information between the systems becomes vital for the enterprise with both ITSM and PPM toolsets. One of the biggest areas of interaction is around Demand Management. Come and see Rego's Integration solution which flexibly allows for ServiceNow records (Incident, Problem, Idea, Enhancement, and Demands) to generate CA PPM Ideas or Projects. This lets you control where you want to perform Demand Management, and the work lands in CA PPM's Project either way.” Download is the slide deck used for the presentation.
 -
 Canada Life shares their Clarity Implementation experience, and the lessons learned from the process.
 -

 The Capacity Graph portlet displays Availability, Allocations, Actuals and Assignments for one or more active resource(s) in a single view. This portlet pulls data from timeslices, and allows the user to filter on a weekly, monthly or quarterly data. The Estimated Time to Complete (ETC) and Allocation data will only show for projects that are active. This portlet provides Resource Managers, PMOs and Executives with a simple way to analyse: Allocations vs. Availability, Allocations vs. Actuals, Allocations vs. ETC and ETC vs. Availability. The graph allows the user to determine where areas of improvement may exist and quickly identify potential areas of constraint. Note: the information displayed is dependent on what the user has security rights to view.
 -
The Capacity Graph portlet displays Availability, Allocations, Actuals and Assignments for one or more active resource(s) in a single view. This portlet pulls data from timeslices, and allows the user to filter on a weekly, monthly or quarterly data. The Estimated Time to Complete (ETC) and Allocation data will only show for projects that are active. This portlet provides Resource Managers, PMOs and Executives with a simple way to analyse: Allocations vs. Availability, Allocations vs. Actuals, Allocations vs. ETC and ETC vs. Availability. The graph allows the user to determine where areas of improvement may exist and quickly identify potential areas of constraint. Note: the information displayed is dependent on what the user has security rights to view.
-
 A presentation slide deck from Rego University 2022. This document reviews the best practices around change and impact management.
- Introduction
- Change and Impact Basics
- How did we get here?
- Demo and Discussion
-
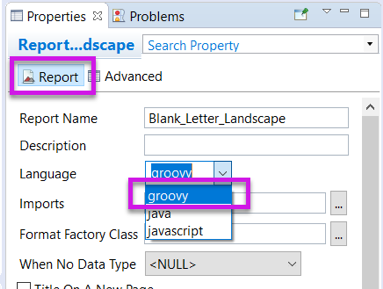 Changing the report programming language can allow the report developer to use other languages (such as Groovy or Javascript) instead of Java methods in expressions. This can be useful in debugging report code.
 -
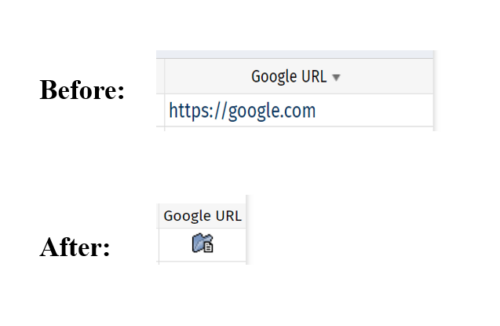 This tech-trick defines how a URL attribute can be changed to an image in a list view via CSS.
 -
 The Changing Application Logo and Title tech trick provides an overview of how to change the logo and title within the application. This allows administrators to rebrand Clarity to their own logo and title. By customizing the logo, employees may be more encouraged to take ownership of the tool.
 -
 Just getting started with Clarity Studio? Join us to learn how to create new objects, CITs, attributes, and lookups in your Clarity environment.
 -
 No matter how hard we try, many organizations cannot pry Excel out of the hands of project and resource managers. In this class we will explore possibilities that give up the battle and embrace Excel as a great data entry tool. We will show some neat case studies on quick Excel integrations deployed at customers.
 -
 Struggling to use an external scheduler like MS Project or Smartsheet with Clarity or investigating its potential? Learn how to effectively use these tools with Clarity in this training, which includes best practices and lessons learned. We will show both OOTB and Rego build connectors that will make the bidirectional connections seamless.
 -
 Are your project teams using SharePoint effectively and getting the most value out of it? Is document management a daily struggle? Learn how to use SharePoint with Clarity in a more seamless way to improve collaboration and team productivity.
 -
 Are your project teams using SharePoint effectively and getting the most value out of it? Is document management a daily struggle? Learn how to use SharePoint with Clarity in a more seamless way to improve collaboration and team productivity.


Copyright 2023 • Rego Consulting Corporation • Privacy Policy