-
 Part of the Business Transformation collection, this portlet displays count of the planned benefits (savings) per project manager. It also displays if any of the planned benefits are Critical/ At Risk / On Track, along with the total planned benefit amount.
 -
Part of the Business Transformation collection, this portlet displays count of the planned benefits (savings) per project manager. It also displays if any of the planned benefits are Critical/ At Risk / On Track, along with the total planned benefit amount.
-
 Course Description: Are you ready to implement a continuous improvement practice within your PMO? This class is a working session to help build and sustain a continuous assessment initiative within your PMO, helping to manage goals and objectives from start-up through maturity. We will also discuss growth mapping to processes, tools, and strategic objectives.
 -
 Course Description: Some PMO members have started receiving questions about the relevance of the PMO. This session will discuss why the PMO is even more relevant for an organization as it shifts to an Agile mindset.
 -
 Course Description: How mature is your PMO? Where do you go from here? This class is a working session, which includes an exercise to assess how far you’ve come and help direct your course.
 -
 Are you considering or analyzing PMO value metrics? This class is a working session will cover lessons learned in PMOs, so you can craft guiding metrics, with or without a tool.
 -
 PMOs/EPMOs are feeling some pressure from Agile disruptors in their organizations. Some Agile purists insist that they can do everything with an Agile tool and no PMO governance, but this really isn’t the case. If you belong to a PMO or EPMO, this session will help you to better collaborate with your Agile counterparts in finding better and more holistic solutions to value delivery.
 -
 A Quick Reference Guide to assist in the process of populating Project Properties. The document uses screen shots from the Classic UX with the Phoenix theme.
 -
 A Quick Reference Guide to assist in the population of the Project Property Details. Reviews accessing and updating the project property details. Also shows alternative in-line edits.
 -
 This training document is a Rego Consulting Quick Reference Guide to assist with the population of project properties in Clarity’s Modern User Experience. Documents starts with accessing the project via the Tile module. Then shows how to update properties in the Details page and in the Project List.
 -
 Many organizations are moving from a waterfall development approach toward agile methodologies and frameworks. This transformation impacts the financial structure of IT and can create changes in the way the TBM model needs to be built. In this session we will give a high-level overview of what an Agile Business Operating Model is and the potential impacts it could have so you can understand how to integrate this into your TBM practice.
 -
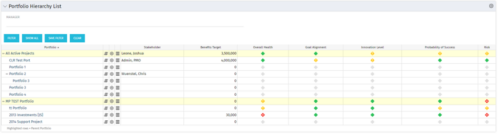 Part of the Business Transformation Package, this portlet displays the portfolios with hierarchy (child portfolio(s)). The portlet displays the basic portfolio fields like – manager, stakeholder, etc. A Metrics subpage can be created with the fields on the “Properties – Metrics.”. The fields: Overall Health, Goal Alignment, Innovation Level, Probability of Success are custom fields and can be configured on a subpage.
 -
Part of the Business Transformation Package, this portlet displays the portfolios with hierarchy (child portfolio(s)). The portlet displays the basic portfolio fields like – manager, stakeholder, etc. A Metrics subpage can be created with the fields on the “Properties – Metrics.”. The fields: Overall Health, Goal Alignment, Innovation Level, Probability of Success are custom fields and can be configured on a subpage.
-
 A slide deck from Rego’s training class on Portfolio Management using Clarity’s Classic UX. Covers an introduction to Portfolio Management including definition, portfolio contents, PfM roles and responsibilities, how portfolios work, data used, key deliverables, prerequisites for starting PfM, and PfM security.
 -
 Course Description: Do you want to understand the OOTB configuration and functionality of portfolio management? In this class, we will review the OOTB objects, views, and functions of portfolio management.
 -
 A Quick Reference Guide to assist in the use of the Waterline to Optimize Portfolios in Clarity’s Classic UX. Reviews waterline menu, ranking rules, and use of filters.
 -
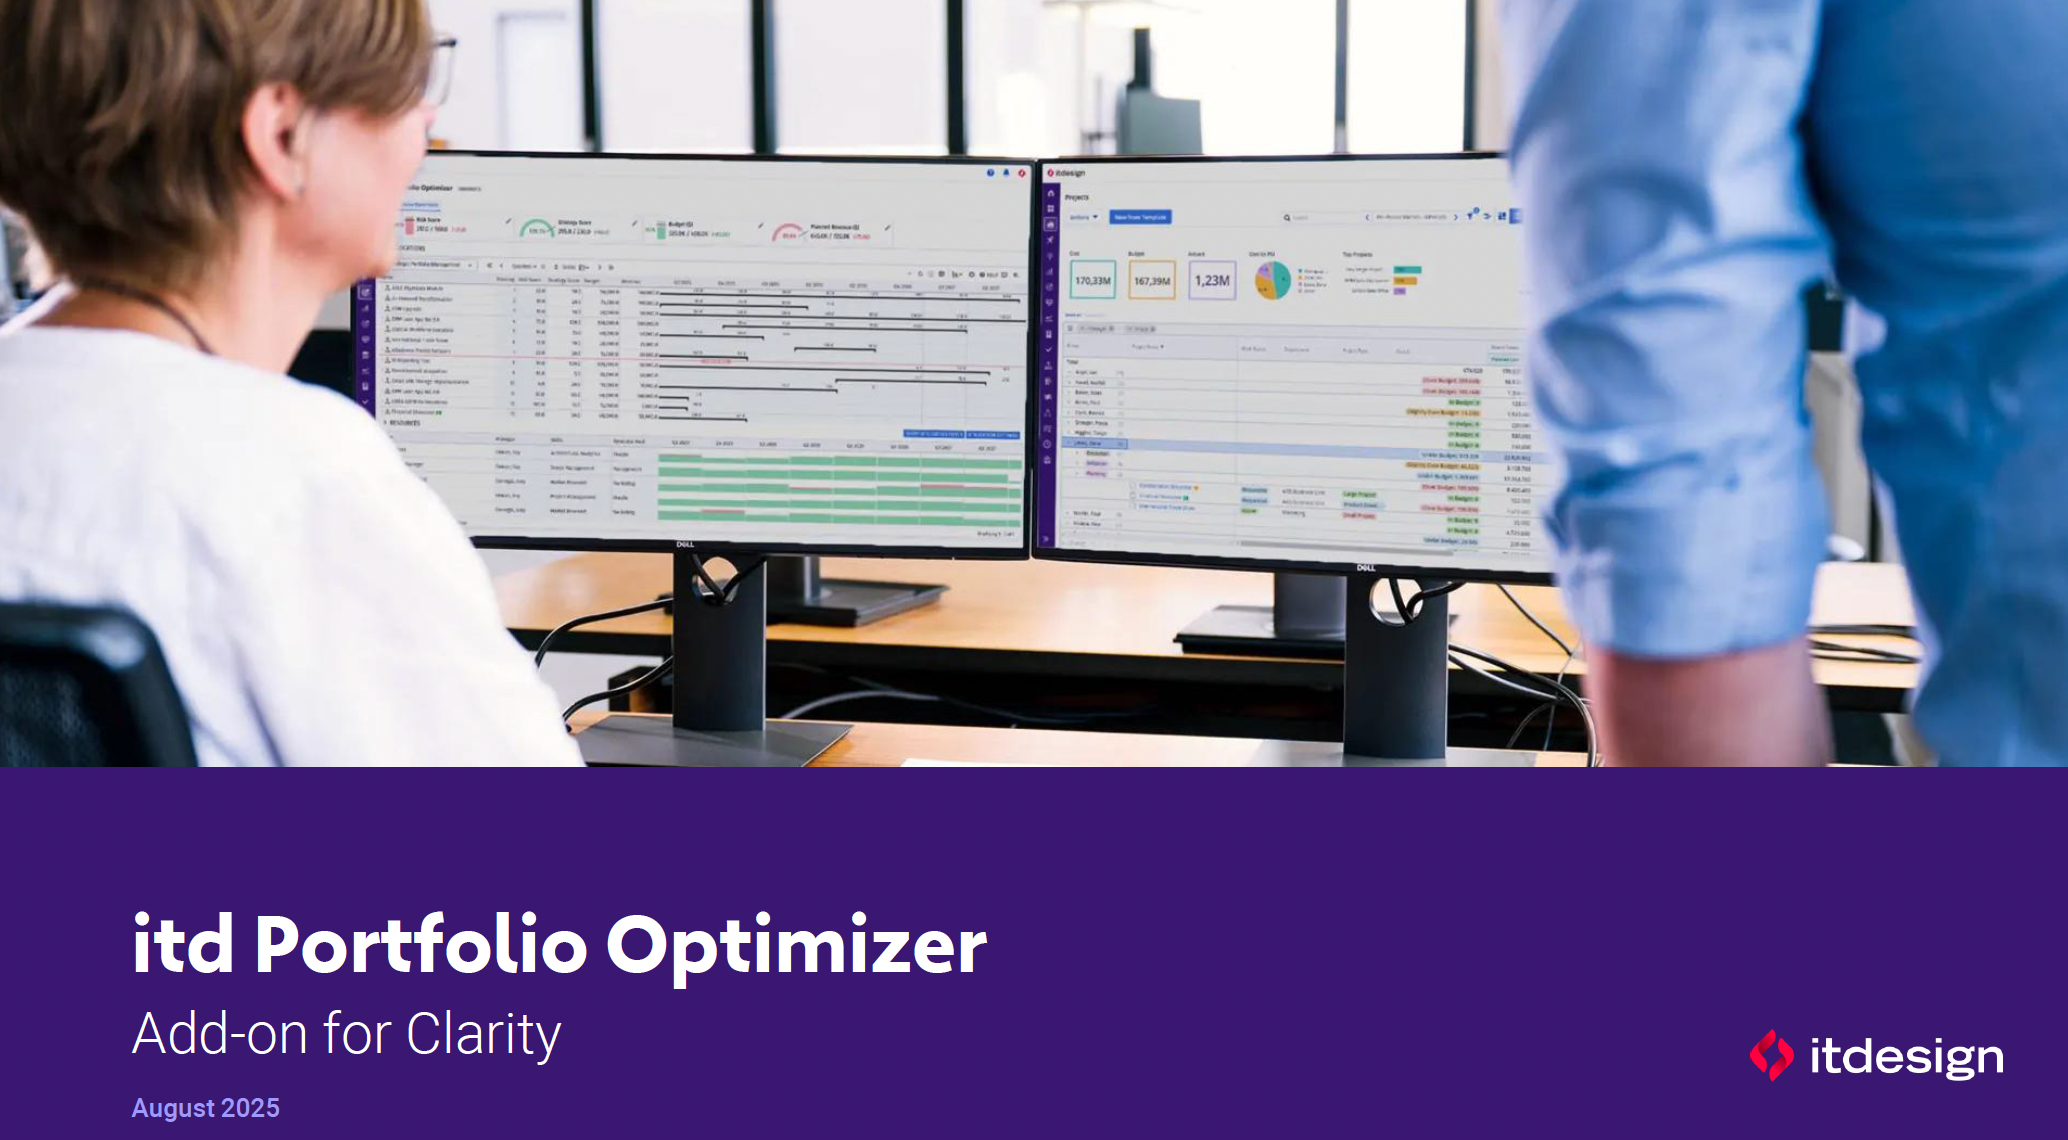 ItDesign has a new Clarity Add-on for portfolio management. In this class they will introduce the Portfolio Optimizer.
 -
 Part of the Business Transformation collection, this pie chart portlet displays realized benefit, grouped by category for portfolio investments. It uses System Provider: Portfolio Investment Provider.
 -
Part of the Business Transformation collection, this pie chart portlet displays realized benefit, grouped by category for portfolio investments. It uses System Provider: Portfolio Investment Provider.
-
Part of the Business Transformation collection, this pie chart portlet displays realized benefit, grouped by category for portfolio investments. It uses System Provider: Portfolio Investment Provider.
-
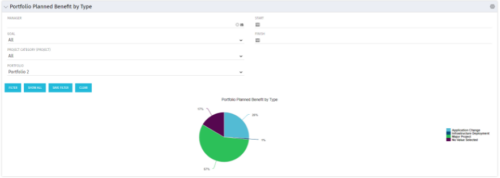 Part of the Business Transformation collection, this pie chart portlet displays realized benefit, grouped by type of project, for portfolio investments. It uses System Provider: Portfolio Investment Provider.
 -
Part of the Business Transformation collection, this pie chart portlet displays realized benefit, grouped by type of project, for portfolio investments. It uses System Provider: Portfolio Investment Provider.
-
Part of the Business Transformation collection, this pie chart portlet displays realized benefit, grouped by type of project, for portfolio investments. It uses System Provider: Portfolio Investment Provider.
-
 A Quick Reference Guide to assist in the use of the Portfolio Reporting in Clarity’s Classic UX. Reviews the Scorecard in the Portfolio menu, portlet available, and exporting data as reports.
 -
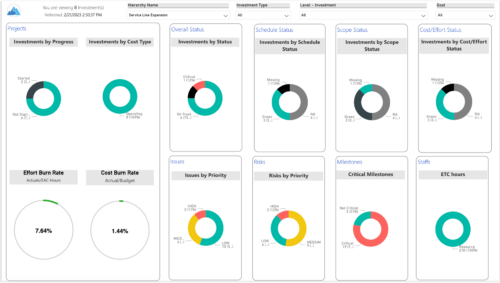
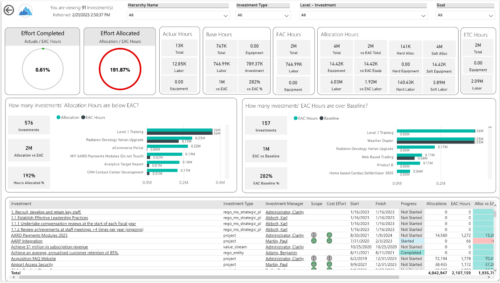
 Summarize an ad hoc list of investments or leverage your defined hierarchies to visualize and evaluate the performance of your portfolios, including financial data analysis. Report Views include: • Change Requests • Cost Trend • Cost • Effort Trend • Effort • Hierarchy Summary • Investment Drill Thru • Investment Gantt • Issue Summary • Milestones • Risk Summary • Staff • Status Report Summary • Tasks Demo Video - https://www.youtube.com/watch?v=UNByLAWJ2Nw&list=PLXJ5ktuWV0jiS9CvBpHvBIwpKPmA9uvwK&index=4 The main .rpt file will access data through the Data Warehouse. For clients on Rego’s AWS hosting, we have versions that work with Oracle and Postgres DB and access the live database, if the Rego Odata connector is being used.
 -
 Summarize an ad hoc list of investments or leverage your defined hierarchies to visualize and evaluate the performance of your portfolios, including financial data analysis. Report Views include:
- Change Requests
- Cost Trend
- Cost
- Effort Trend
- Effort
- Hierarchy Summary
- Investment Drill Thru
- Investment Gantt
- Issue Summary
- Milestones
- Risk Summary
- Staff
- Status Report Summary
- Tasks
-
 A Quick Reference Guide for utilizing Portfolio Targets in Clarity’s Classic UX. Reviews the target menu and using breaking down roles for use in portfolios.
 -
 Are you starting a demand/portfolio management implementation, or do you want to compare how you are using these functions vs. others or best practices? In this class we will discuss some best practices from successful customers.
 -
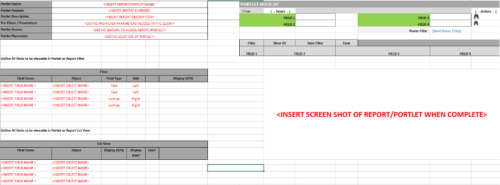 This Excel document provides a template for mocking up and validating portlet requirements. The template is important to use to help end users visualize the final output of a portlet. Template Defines:
- Portlet Name
- Portlet Purpose
- Portlet Description
- Portlet Security
- Portlet Placement
- Portlet Filter Fields/Layout
- Portlet Grid Fields/Layout
-
 Are you ready to go beyond simple graph and grid portlets? This class will show you how to create and export portlets with hierarchical structure and drill-down capability, and includes examples of advanced portlets and complex queries.
 -
 Course description: “Are you ready to go beyond simple graph and grid portlets? This class will show you how to create and export portlets with hierarchical structure and drill-down capability, and includes examples of advanced portlets and complex queries.” Download file is the presentation slide deck.
 -
 Utilize the PowerBI against the Clarity ODATA connector to get critical data for rich reports and dashboards. This class is a hand on beginner training class for PowerBI - learn how to build basic reports against the Clarity data warehouse.
 -
 Utilize Power BI with the Clarity ODATA connector to get critical data for rich reports and dashboards. This class is a hands-on beginner training for Power BI. learn how to build basic visuals and reports against the Clarity data warehouse.
 -
 A presentation slide deck from Rego University 2022. The course outline for creation of Power BI Dashboards for Clarity, Beginner Level.
- Overview
- Connecting to Data Sources
- Reports and Dashboards
- Creating a Report
- Data Import Options
- Data Transformation
-
 Utilize the PowerBI against the Clarity ODATA connector to get critical data for rich reports and dashboards. This class is a hand on beginner training class for PowerBI - learn how to build basic reports against the Clarity data warehouse.


Copyright 2023 • Rego Consulting Corporation • Privacy Policy