
- Introduction (What & Why)
- Definition & Uses of Requirements
- The Challenges in Requirements in Software
- Revisit the Agile Taxonomy
- The Transition from Traditional to Agile
- Rethink the Agile Portfolio
- Guidelines and Characteristic of Taxonomy
-
 A presentation slide deck from Rego University 2022. The course discusses factors that differentiate Requirements.
 -
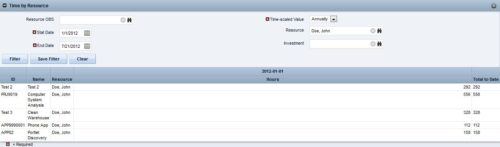
 This portlet displays the actual hours resources entered against investments. The per-period actual hours can be showed in days, weeks, months, quarters, or years. The data can be filtered by Resource, Resource Manager, OBS Unit, Investment and time period
 -
 The Executive Dashboard portlet displays information regarding projects the user has security rights to view. It provides a one-stop place for the PMO or management to view all critical information about projects. The portlet not only displays status indicators as well as dates for late items, variances and days late, but also displays the project status fields from the Status Report sub-object.
 -
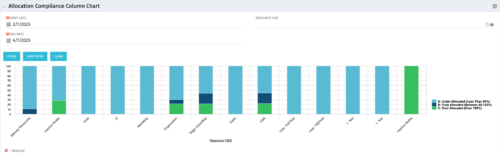 This view depicts Allocation Compliance for resources grouped by OBS. Using the daily Resource Availability and Daily Resource Allocation Time Slices this column chart groups aggregate Allocation vs Availability by OBS Unit. The chart allows quick analysis to see if resources are adequately allocated (between 80% to 120% of their capacity) or if they are significantly under or over allocated. NOTE: The grouping of OBS unit is limited to 1 level below the selected OBS in the portlet filter.
 -
 The All Issues portlet displays all Issues related to active projects that the logged in user has view rights to. The portlet provides the project manager a single place to view issues across multiple projects without having to go into each project individually, and allows for more efficient management and reporting across projects. The filter then allows the user to narrow their search by Issue ID, Issue Name, Project ID, Project Name, the individual to whom the issue is assigned, and Issue Status. You may also narrow the view to display issues with a target resolution date within a certain date range, or Issues associated with a particular Category or OBS unit. Note: Only the projects that the user has viewer rights to will show up in the list.
 -
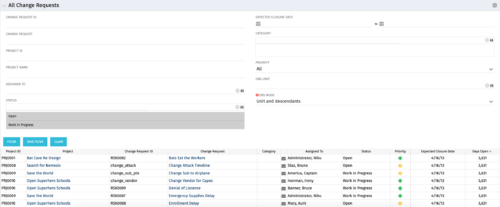 The All Change Request portlet displays all change requests related to active projects that the logged in user has view rights to. The portlet provides the project manager a single place to view change requests across multiple projects without having to go into each project individually and allows for more efficient management and reporting across projects. The filter allows the user to narrow their search by date ranges, resources involved, and/or the project with which the Change Request is associated. Other alternatives for filtering include the category, priority or status of the Change Request. In the list view, a status is displayed for each Change Request (CR), along with the Project with which the CR is associated, the CR ID, the CR name, the resource to whom the CR is assigned, Priority, Expected Closure Date, and number of days the CR has remained open. Note: Only the projects that the user has viewer rights to will show up in the list.
 -
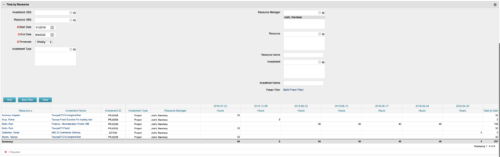
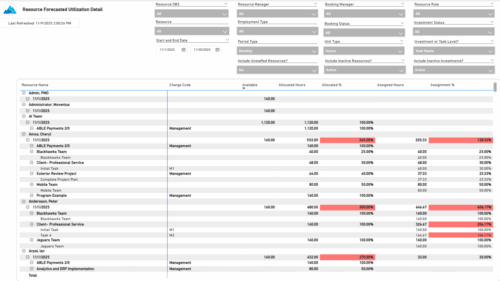 The Resource Forecasted Utilization Detail report provides a detailed view of resource utilization by showing availability, allocation, and assignment values at both the investment and task level. The report is grouped by resource and time period, with data displayed weekly or monthly, as well as in total. Values can be shown in hours or full-time equivalents (FTEs), supporting detailed analysis of workload and forecasted demand.
 -
 The Project Status Detail report provides a comprehensive view of each project’s key elements, including team allocations, major milestones, risks, issues, and change requests. It highlights the most relevant project indicators to give stakeholders a clear understanding of project health and progress. This report supports detailed tracking and review of project performance across multiple dimensions.
 -
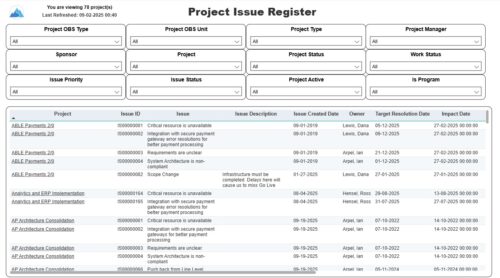 The Project Issue Register report displays comprehensive information for each project issue. The issue register also provides the option to display items that are associated to the issue such as notes, action items, and tasks. Report Prerequisites Verify that you have completed the following prerequisites before you run this report: • The project must have at least one issue for the project to display in the report. • The issue properties must have fields such as description, category, resolution, target resolution, impact date, and originating ID completed for them to display data in the report. The issue name, issue ID, priority, status, and owner are required in Classic PPM so they always display data.
 -
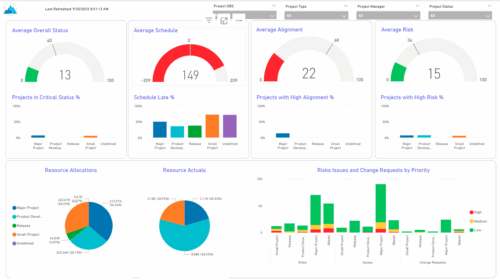 The KPIs by Project Type (Dashboard) report provides visibility into key project health measures, including status, schedule, alignment, and risk. Gauge visuals highlight each KPI at a summary level, while column charts break down results by project type. Resource allocation and actual hours are summarized in pie charts, making it easy to compare utilization across project types. In addition, bar charts display the number of issues, risks, and change requests by project type and priority, helping teams quickly identify areas of concern.
 -
 Discover Rego's integration tools that are specifically built to help develop and standardize the integration process. Learn about Rego's Data Extractor - a highly configurable and efficient tool to extract Clarity data into flat files. And also Rego's Data Processor - a highly configurable tool that abstracts the most common development tasks for an inbound integration. We'll review both tools and discuss integration best practices.
 -
 This beginner-friendly course provides an introduction to navigating the application. We'll cover grids, filters, views, and account settings.
 -
 This round table discussion will focus on Clarity configurations using Studio. A well-configured Clarity environment will minimize performance bottlenecks, ease development, and increase end user adoption. Join us to discuss best practices around object structure, naming conventions, audit trail settings, and more.
 -
 Aligning work to organizational strategy is a fundamental requirement in today's ever-changing marketplace. High performing organizations are moving beyond basic connections to introduce strategic hierarchies that are tied to real measurements of business value via Clarity's Objectives and Key Results (OKRs). Join our expert guides as they present key concepts, best practices, and the evolution of strategic alignment.
 -
 Prosci presents an AI Adoption Workshop with a focus on getting a ROI on your investment in AI.
 -
 What if you could see tomorrow’s challenges and opportunities before they happen? Join us for an exclusive demo of new Predictive Analytics features for Clarity. You'll discover how predictive insights can deliver early warnings, risk signals, and actionable recommendations—empowering you to move from reactive firefighting to proactive decision-making.
 -
 Want to boost Clarity adoption and data quality, all while having fun and keeping users engaged? Learn how gamification can benefit your organization in this exclusive demo. Check out features that reward users for desired behaviors, enable personalization, and offer fun ways to track project health through the animated world of Planimals.
 -
 The need to report and organize work around the Products continues to grow. Join this session to hear how Project and Product Management can thrive together in Clarity.
 -
 The Project Risk Register report provides visibility into project risks, including detailed information on each risk and its associated items such as notes, action items, tasks, and related risks or issues. Results can be grouped by project or viewed without grouping to support flexible analysis. Interactive visuals make it easy to track, monitor, and manage risks across projects.
 -
 London Stock Exchange shares their Clarity journey (since 2008) and where they want to take the tool next. Current goals are: • Moving toward standardized ways of working. Focused on connecting our ecosystem of tools with Clarity as a focal point for Portfolio Management and SPM. • With an end goal of Faster Time to Market, on a journey to be a Customer Lead organization.
 -
 Hear from existing Clarity customers as they share what's working well in their implementations. Gain insights from these real-world success stories. This deck is from Day 2 of the presentations.
 -
 Transitioning to the modern UX or implementing Clarity for the first time? Learn how to configure Modern UX: - First time setup - navigation and modules - Blueprints (basic) - Personalize the UI/Announcements
 -
 Does your organization own Apptio or looking to purchase it? In this session we will dive into what Apptio is and how it complements your current Clarity solution.
 -
 Broadcom's ValueOps solution now incorporates automation and analytics technology, providing the ability to align your digital initiatives to business outcomes and significantly improve the speed at which teams deliver business outcomes.
 -
 Learn how to discover business processes and automation patterns, using new technology from ConnectALL to power your Value Stream Management. The key is to understand and map automation patterns that both enables new business and accelerates adoption of ValueOps
 -
 Are you still using the classic User Experience? Are you wondering how and when you should transition to the ModernUX? This class will be a practical guide on how to move your users to the ModernUX. We will discuss real use cases and help provide guidance on this strategic decision. We also plan to have a portion of the class that is Q&A from customers that have moved.
 -
 A Quick Reference Guide to assist in the administrative process of updating an Attribute Color in Clarity. The display mappings of an attribute can be configured to indicate a range of values or specific values using colors.
 -
This training document is a Rego Consulting Quick Reference Guide to assist with the management of Custom Investments in Clarity’s Modern User Experience. This doc references version 16.2.1 views. Document provides detail on how to navigate to custom investments and provides detail on the modules that are available within a custom investment.
-
This training document is a Rego Consulting Quick Reference Guide to assist with the creation and management of Ideas in Clarity’s Modern User Experience. This doc references version 16.2.1 views. Doc covers creation of ideas, adding columns to the grid view and editing existing ideas.
-
This training document is a Rego Consulting Quick Reference Guide to assist with Idea approval and conversion to projects in Clarity’s Modern User Experience. This doc references version 16.2.1 views. Doc reviews setting Ideas as Approved and converting Ideas to projects.
-
 A guide to using RegoXchange, the Clarity content library. Goes through Registration, Finding Content, and Downloading the files.
 -
 This training document is a Rego Consulting Quick Reference Guide to assist with the entering of financial transactions in Clarity’s Classic User Experience. This doc references version 16.1.2 views. Document provides basic information on the definition of a transaction and the composition of transaction items. Detail is provided on how to create a new transaction from the Transaction Entry page of the Classic User Experience. Information is provided on how to enter detail into each individual line item for a transaction.
 -
 This training document is a Rego Consulting Quick Reference Guide to assist with the management of Custom Investments in Clarity’s Modern User Experience. This doc references version 16.1.2 views. Document provides detail on how to navigate to custom investments and provides detail on the modules that are available within a custom investment.
 -
 This training document is a Rego Consulting Quick Reference Guide to assist with the creation and management of Ideas in Clarity’s Modern User Experience. This doc references version 16.1.2 views. Doc covers creation of ideas, adding columns to the grid view and editing existing ideas.
 -
 A presentation slide deck from RegoU 2023. This course was a presentation by Apptio on their Product Roadmap.
 -
 Do you have enough experience with the data model to be dangerous - maybe just the basic project and resource tables? This class will take you to the next level in understanding the Clarity data model and provide training on how to write NSQL queries within Clarity for use in your portlets and reports.
