1906 results
-
 Agile is here to stay, but waterfall may be as well. Companies around the world struggle with living in a bimodal development world, while trying to go through an agile transformation. This session will discuss best practices and lessons learned within companies that have gone through agile transformations. We will also review SAFe as a potential approach.
 -
 No matter how hard we try, many organizations cannot pry Excel out of the hands of project and resource managers. In this class we will explore possibilities that give up the battle and embrace Excel as a great data entry tool. We will show some neat case studies on quick Excel integrations deployed at customers.
 -
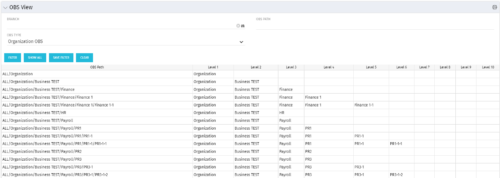 This grid portlet shows the OBS name and ID along with the associated hierarchy, both as an aggregated view along with each of the levels broken out. The table below describes the available filter fields in the portlet.
Column Label Description Branch Branch of the OBS OBS Type OBS to use OBS Path Path of the OBS -
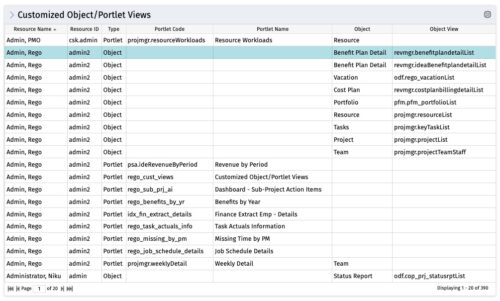 The Customized Object/Portlet Views portlet displays all user edited object/portlet views and the resource(s) that have edited them. This can assist in identifying users who need to be notified prior to publishing view changes. The table below describes the available columns on the object.
Column Label Description Resource Name Name of the resource Resource ID ID of the resource Type Object or Portlet Portlet Code ID of the portlet Portlet Name Name of the portlet Object Associated Object Object View ID of the modified view on the object Object Code Internal code used by the query pkid Internal code used by the query portlet_dbid Database id of the portlet res_dbid Database id of the resource -
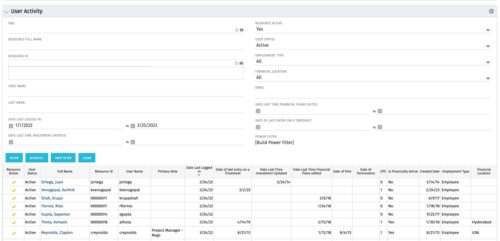 The User Activity portlet is in essence an expansion of the out of the box User List by License Type portlet, which only display the Last Logged In date of resources. This portlet offers several additional fields to help admins dig deeper into user activity within the tool. The table below describes the available filter fields for the portlet.
Column Label Description OBS OBS the resource(s) belong to Resource Full Name Resource’s First and Last Name Resource ID Resource’s ID First Name Resource’s First Name Last Name Resource’s Last Name Date Last Logged In Date the Resource last logged in Date Last Time Investment Updated Date the Resource last made an Investment update Resource Active The Resource’s active status Employment Type Resource’s Employment Type Financial Location Resource’s Financial Location Email Resource’s Email Address Date Last Time Financial Plans Edited Date the Resource last made a Financial Plan edit Date of last entry on a Timesheet Date the Resource last made an entry on a timesheet Created Date Date the resource was added to the system Date of Hire Resource’s Date of Hire Date of Termination Resource’s Date of Termination Financial Department Resource’s Financial Department Home Page Resource’s Home Page Language Default Language of the Resource Primary role Resource’s Primary Role Resource manager Resource’s Manager Track Mode Resource’s Track Mode User Name Resource’s Username -
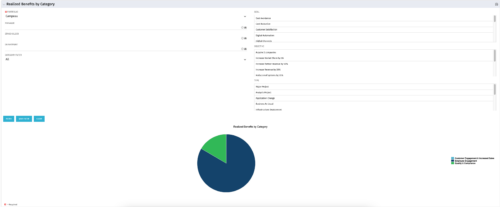 This is a pie chart portlet to show realized benefits across the system by category, including a category for no category or unspecified. Pie chart shows categories of realized benefits in its slices. Available filters:
- Portfolio (required)
- Manager
- Stakeholder
- Department
- Category Filter (default to all)
- Goal
- Objective
- Type
-
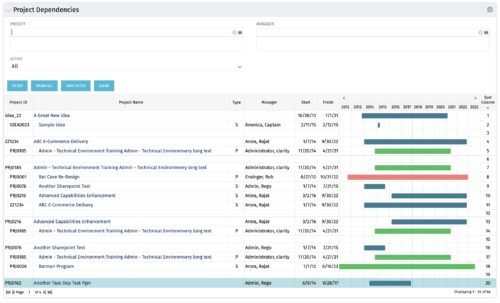
The Project Dependencies portlet displays all projects and their associated dependencies that the logged in user has rights to. This can assist in scheduling and visualizing the breakout of dependencies. The table below describes the available columns in the portlet. Column Label Description Project ID ID of the project Project Name Name of the project Type Relationship to above project, Parent Project (P) or Sub Project (S) Manager Manager of the project Start Start Date of the project Finish Finish Date of the project Gantt Visualization of project timelines Sort Column Used to order the columns for proper display of the portlet dimkey Internal code used by the query Inv_hlth_int Internal code used by the query Link_dbid Internal code used by the query link_toggle Internal code used by the query rel_active Internal code used by the query rel_dbid Internal code used by the query rel_mgr_dbid Internal code used by the query rel_sort Internal code used by the query -
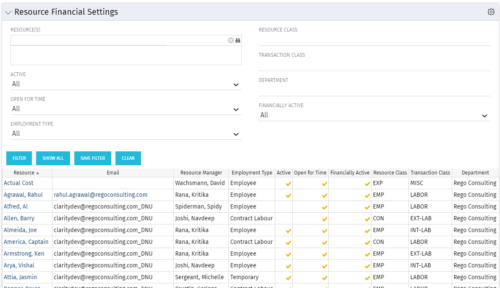 Resource Financial Settings portlet provides resource managers a single place to view financial settings of various resources. It is a grid portlet that displays Resource details such as Name, Email, Manager, Employment Type, Is Active?, Is Open for Time?, Resource Class, Transaction Class and Department. You can further narrow your search by Resource(s), Active, Open for Time, Employment Type, Resource Class, Transaction class and Department.
 -
 Pie Chart Portlet displays counts of active projects with various Stale ratings. Calculation is Percent Stale Tasks = number of open (not completed) tasks with a finish date over 15 days old, divided by total open tasks. Filterable by OBS structure and project manager. Data label = project count. Mouse-over and Legend labels = stale rating. More than 90% Stale means 90 to 100% of open tasks on a project have finish dates older than 15 days. More than 71% Stale means 71 to 89% of open tasks on a project have finish dates older than 15 days. 0 - 70% Stale means fewer than 70% of open tasks on a project have finish dates older than 15 days.


