-
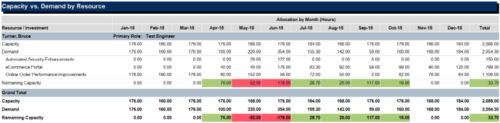
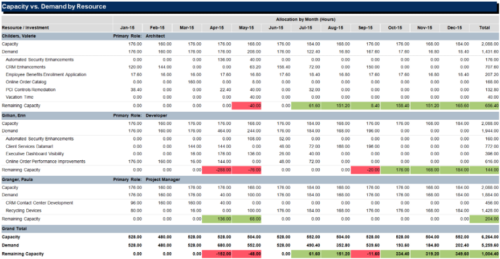 The Capacity vs Demand by Resource report is a transaction based Jaspersoft report that does not require the Load Jaspersoft Datawarehouse job to be run. The report will pull real-time data from the transaction tables in Clarity. This report can be run from either the Advanced Reporting or Reports and Jobs area within Clarity. The Capacity vs. Demand by Resource report displays resource capacity and demand at the resource level across investments. The report gives you visibility into the capacity, demand, and remaining capacity by resource. The report displays amounts by week or month, and in total. The amounts might be displayed as hours or FTEs.
 -
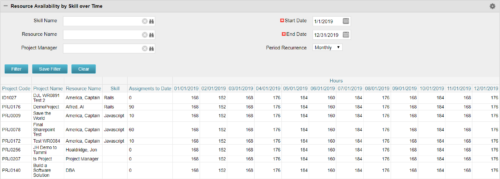 Resource Availability by Skill over Time is a grid portlet that provides Resource Managers a single place to view Resources’ skill sets along with their availability (hrs.) over a period of time. This report also displays the assigned Investments to date and the Actual hours to date for the Resource on those respective Investments. Users can further narrow their search by Skill Name, Resource Name, Project Manager, Start Date, End Date and Period Recurrence.
 -
Resource Availability by Skill over Time is a grid portlet that provides Resource Managers a single place to view Resources’ skill sets along with their availability (hrs.) over a period of time. This report also displays the assigned Investments to date and the Actual hours to date for the Resource on those respective Investments. Users can further narrow their search by Skill Name, Resource Name, Project Manager, Start Date, End Date and Period Recurrence.
-

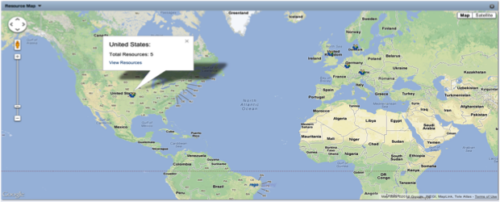 The Resource Map portlet is designed to display resource counts, by country, on a map of the world. Clicking one of the resource markers on the map will display the total resource count for that country. Additionally, a link is provided that connects to a grid portlet which displays all resources that reside in that country. The ability to zoom in and out on areas of the world is available. Due to the requirements outlined in the Special Installation Instructions section, this portlet requires 2-3 Rego Consulting hours to install. Further customization of the data on this map and its associated grid portlet may be requested. Please contact us for more details.
 -
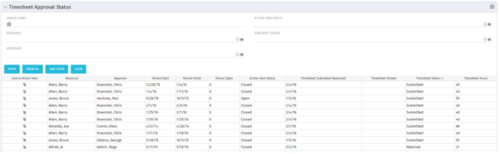 Portlet to show the stage of any Action Item triggered by Timesheet submission. Portlet allows for a period start date input, filters by Resource, Approver, Action Item Status and Timesheet Status. A link to the action item is provided for direct action by review if needed. This portlet is only for the clients who have established a process that triggers on Timesheet Status change to Submitted and to send Action Items to the person responsible for timesheet approval/validation i.e. PM for project tracking and/or RM for overall approval of the timesheet. The portlet won’t display any data if there are no timesheet Action Items. Examples of such processes would be CA’s OOTB Project Manager Approval or the Timesheet Approval - PM and RM process found on RegoXchange.
 -
Portlet to show the stage of any Action Item triggered by Timesheet submission. Portlet allows for a period start date input, filters by Resource, Approver, Action Item Status and Timesheet Status. A link to the action item is provided for direct action by review if needed. This portlet is only for the clients who have established a process that triggers on Timesheet Status change to Submitted and to send Action Items to the person responsible for timesheet approval/validation i.e. PM for project tracking and/or RM for overall approval of the timesheet. The portlet won’t display any data if there are no timesheet Action Items. Examples of such processes would be CA’s OOTB Project Manager Approval or the Timesheet Approval - PM and RM process found on RegoXchange.
-
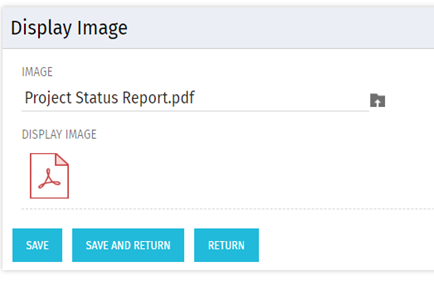 There are many times user’s wants to see the preview of file uploaded on attachment attribute. This Technical Trick will illustrate the steps for an Administrator to preview an attachment. This solution will help to preview PDF, Text file and Image(.png) file. For Microsoft word, PowerPoint and Microsoft Excel, it displays an icon.
 -
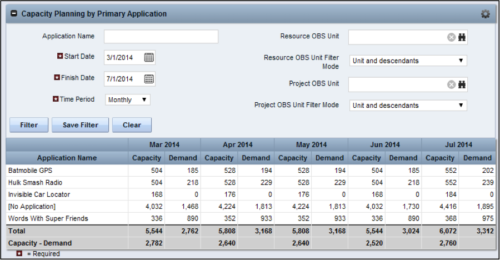 The Capacity Planning by Primary Application portlet displays the capacity and demand by primary application for a selected timeframe. This portlet is used to determine which applications are in high demand, being used efficiently, and how much capacity may be remaining for the time period. The portlet may be filtered by application name, resource OBS or project OBS to narrow the results. The timeframe can be set to display daily, weekly, monthly, quarterly, or annually.
 -
The Capacity Planning by Primary Application portlet displays the capacity and demand by primary application for a selected timeframe. This portlet is used to determine which applications are in high demand, being used efficiently, and how much capacity may be remaining for the time period. The portlet may be filtered by application name, resource OBS or project OBS to narrow the results. The timeframe can be set to display daily, weekly, monthly, quarterly, or annually.
-
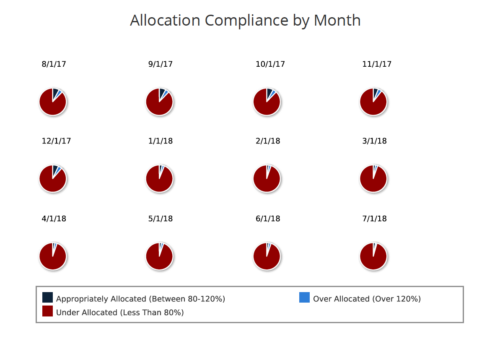 Allocation Compliance Pie Chart provides the resource manager a single place to view the Monthly Resource Allocation compliance for all resources in the form of a Pie chart. A separate Pie chart is displayed for each month. Allocation Compliance is calculated based on the value of 'Availability to Allocation Hours %'. Allocation Compliance is 'Under Allocated (Less Than 80%)' WHEN 'Availability to Allocation Hours %’ is less than 80. Allocation Compliance is 'Appropriately Allocated (Between 80-120%)' WHEN 'Availability to Allocation Hours %' is between 80 and 120. Allocation Compliance is 'Over Allocated (Over 120%)' WHEN 'Availability to Allocation Hours %' is greater than 120. User can further narrow their search by Resource Is Active? , OBS Type, OBS Path and Month Start Date. User can use exact dates or relative dates for Month Start Date filter parameter.
 -
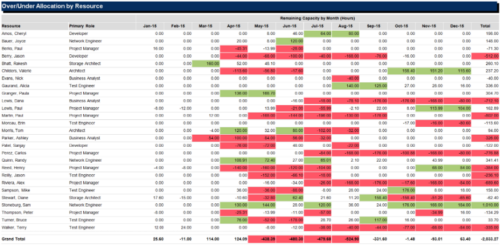 The Over/Under Allocation by Resource report is a transaction based Jaspersoft report that does not require the Load Jaspersoft Datawarehouse job to be run. The report will pull real-time data from the transaction tables in Clarity. This report can be run from either the Advanced Reporting or Reports and Jobs area within Clarity. The Over/Under Allocation by Resource report displays resource remaining capacity amounts by resource. The report displays amounts by week or month, and in total. The amounts can be displayed as hours or FTEs.
 -
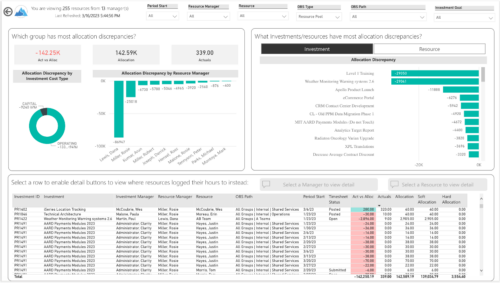
 Evaluate resource allocations, identify bottlenecks, and ensure optimal resource utilization across projects and teams. Report Views include:
- Allocation Discrepancies
- Resource Detail
- Resource Skills
- Resource Summary
- Resource Tasks
- Staffing Allocations
- Staffing ETC
-
 The primary purpose of roles is to determine the amount of resource requests based on unapproved (uncommitted) and approved (committed) projects. Roles are non-named resources which are later allocated to named resources within CA PPM. Using roles is the best way to do "What If" scenario planning and determine needed capacity. This document assists in making Best Practice decisions around setting up roles in Clarity.
 -
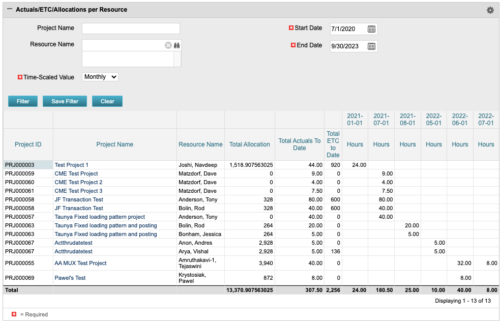 The portlet displays posted time by project for the logged in user based on time period and date range. This allows the user to see at a glance their ETC and actuals on the projects. The portlet displays the Total Allocation and Total Actuals to Date for the user on the projects they are allocated/assigned to. The actuals are displayed per month in the form of TSVs.
 -
The portlet displays posted time by project for the logged in user based on time period and date range. This allows the user to see at a glance their ETC and actuals on the projects. The portlet displays the Total Allocation and Total Actuals to Date for the user on the projects they are allocated/assigned to. The actuals are displayed per month in the form of TSVs.
-
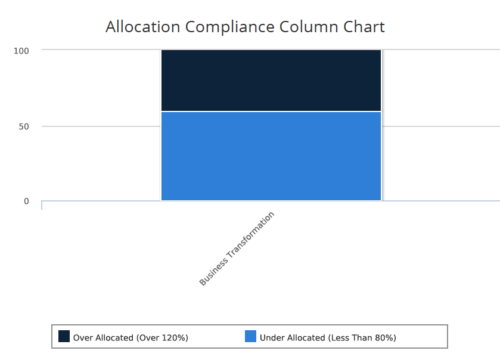 Allocation Compliance Column Chart provides the resource manager a single place to view the Allocation compliance information in the form of a stacked column chart. Allocation Compliance is calculated based on the value of 'Availability to Allocation Hours %'. Allocation Compliance is 'Under Allocated (Less Than 80%)' WHEN 'Availability to Allocation Hours %’ is less than 80. Allocation Compliance is 'Appropriately Allocated (Between 80-120%)' WHEN 'Availability to Allocation Hours %' is between 80 and 120. Allocation Compliance is 'Over Allocated (Over 120%)' WHEN 'Availability to Allocation Hours %' is greater than 120. User can further narrow their search by Resource Is Active?, OBS Type & Path, Associated Project OBS?, Allocation Start Date, Investment Name and Resource Manager. User can use exact dates or relative dates for Allocation Start Date filter parameter.
 -
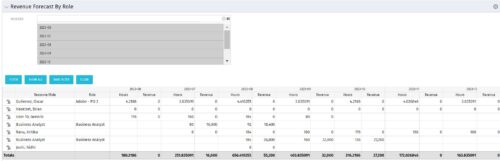 The Revenue Forecast by Role portlet displays forecasted revenue by both resource and role on the given project, broken out by month. The table below describes the available filter fields in the portlet.
Column Label Description Months Fiscal months to display -
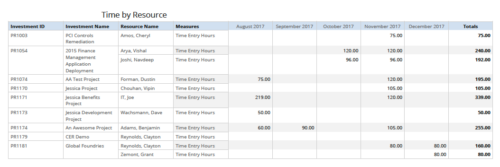 Time by resource is a grid report that provides resource and project managers a single place to view time logged to projects by resource over a period of time. This report provides information such as Investment ID, Investment Name, Resource Name and Time Logged Hours on period basis. Report provides you the flexibility of changing period type to Year, Quarter, Month and Day. You can further narrow your search by OBS Type & Path, Resource Name, Investment Name, Period Start Date and Is Investment Active?
 -
 Without good data, your digital transformation won’t succeed. This session talks about generating and understanding value stream metrics, including how investments and teams are performing.
 -
 Traditional project management isn’t dead, but it is heavily influenced by Agile teams and thinking. This course looks at ways you can help bring together disparate delivery units across the enterprise.
 -
 This session will aligning you with some of the best and most common practices for using Clarity's Resource Management capabilities. Come and learn about the cababilities that come out of the box for resource insights like allocations, assignments, availability and more. Additionally, tips and tricks will be discussed leaving you with a toolkit of ideas for your organization!
 -
 What should I expect to see within my organization related to PM over the next couple of years? How should I prepare my PMs, PMOs, or myself to embrace the new trends within the industry. This class will share Rego's observations on industry trends within PPM.
 -
 Do you want to talk to other customers that are using or plan to use demand management? In this moderated Round Table where customers can share experiences and provide insights on process, configurations, challenges, and successes. We will have an expert panel and then divide into small groups and discuss customer selected topics - 100% sharing.
 -
 Does your organization struggle with resource management? Have you considered creating a Resource Management Office (RMO)? DO you struggle with a lack of Executive sponsorship to drive adoption? This session will review how some organizations are succeeding in driving adoption and effectively manage resources through engaging leadership, RMOs, and using more dedicated resources. Learn about some best practices for driving effective resource management across your organization.
 -
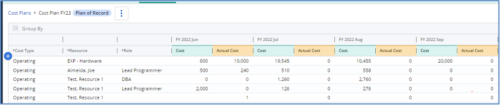
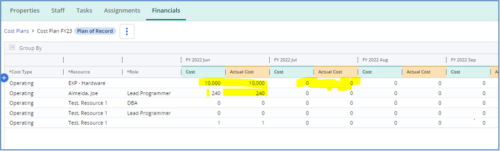 The Populate Prior Periods Forecast From Actuals in Cost Plans process updates Cost Plans for Active Projects, it updates the Forecast for previous months = Posted Actuals, to remove variances from past periods. This is an On Demand process in Clarity named Populate Prior Periods Forecast From Actuals in Cost Plans and can be manually executed from the Organizer or scheduled through the “Execute a Process” job. If there are number of processes in the Organizer – Available Processes, this process can be filtered and then checked to Start. When the process is started it will be seen in the Initiated on the Processes tab. The process status can be monitored from Running to the Completed stage. The process is very flexible and supports Cost Plans with any given grouping and it also works without any dependency on timeslices or other jobs. The process fetches Cost plan of records for all active projects in the system that have Actuals transactions in WIP table. It then process those cost plans to update all of the prior monthly forecast periods with the corresponding monthly Actuals.
 -
The Populate Prior Periods Forecast From Actuals in Cost Plans process updates Cost Plans for Active Projects, it updates the Forecast for previous months = Posted Actuals, to remove variances from past periods. This is an On Demand process in Clarity named Populate Prior Periods Forecast From Actuals in Cost Plans and can be manually executed from the Organizer or scheduled through the “Execute a Process” job. If there are number of processes in the Organizer – Available Processes, this process can be filtered and then checked to Start. When the process is started it will be seen in the Initiated on the Processes tab. The process status can be monitored from Running to the Completed stage. The process is very flexible and supports Cost Plans with any given grouping and it also works without any dependency on timeslices or other jobs. The process fetches Cost plan of records for all active projects in the system that have Actuals transactions in WIP table. It then process those cost plans to update all of the prior monthly forecast periods with the corresponding monthly Actuals.
-
 This training document is a Rego Consulting Quick Reference Guide to assist with General Navigation in Clarity’s Modern User Experience. This doc references version 16.1.2 views. Doc reviews the Menu Bar and User Tool Bar.
 -
 This training document is a Rego Consulting Quick Reference Guide to assist resource managers with the adjusting of timesheets. This doc references version 16.1.2 views. Document provides guidance on how to use the Review & Approve tab to adjust time that has already been entered by a resource.
 -
 This training document is a Rego Consulting Quick Reference Guide to assist resource managers with the approval of timesheets via the Review & Approve tab. This doc references version 16.1.2 views. Doc reviews accessing and selecting timesheets, reviewing submitted timesheets, approving timesheets, approving multiple timesheets, returning timesheets and the timesheet grid.
 -
 This training document is a Rego Consulting Quick Reference Guide to assist with the adding of resources to the Staff tab for Ideas in Clarity’s Modern User Experience. This doc references version 16.1.2 views. Document provides detail on how to add resources to the Staff tab, Default Allocation % and Per-Period metrics.
 -
 This training document is a Rego Consulting Quick Reference Guide to assist with creation and management of resource Teams in Clarity’s Modern User Experience. This doc references version 16.1.2 views. Document provides detail on how to create Teams and add resources to a Team. Instructions are provided on how to add resources by OBS and how to allocate a team to an investment. Team key points are provided with regard to Classic, Allocations, ETC and Financials.


Copyright 2023 • Rego Consulting Corporation • Privacy Policy