
- Resource
- Resource ID
- Email Icon of Resource (So the reviewer can quickly email the Resource)
- Resource is Active
- Resource Open for Time
- Time Period (Start and Finish Dates)
- Timesheet Status
- Is Adjustment (If the timesheet is adjusted)
- Timesheet Modified Date
- Timesheet Posted Date
- Timesheet Submitted By
- Timesheet Approved By
- Project
- Task
- Proposed ETC Hours
- Pending Actual Hours
- Total Actual Hours
-
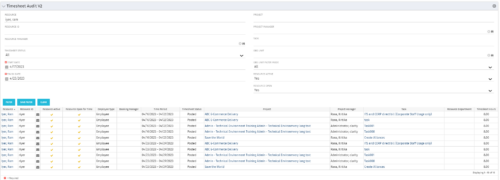 The Timesheet Audit portlet displays timesheet information in order to perform an audit. The only required data needed to search the portlet is start and finish date. Additionally, you may narrow the results by filtering by resource, resource ID, OBS Unit, resource manager, timesheet status, project, and task. The portlet provides reporting on the following:
 -
The Timesheet Audit portlet displays timesheet information in order to perform an audit. The only required data needed to search the portlet is start and finish date. Additionally, you may narrow the results by filtering by resource, resource ID, OBS Unit, resource manager, timesheet status, project, and task. The portlet provides reporting on the following:
- Resource
- Resource ID
- Email Icon of Resource (So the reviewer can quickly email the Resource)
- Resource is Active
- Resource Open for Time
- Time Period (Start and Finish Dates)
- Timesheet Status
- Is Adjustment (If the timesheet is adjusted)
- Timesheet Modified Date
- Timesheet Posted Date
- Timesheet Submitted By
- Timesheet Approved By
- Project
- Task
- Proposed ETC Hours
- Pending Actual Hours
- Total Actual Hours
-
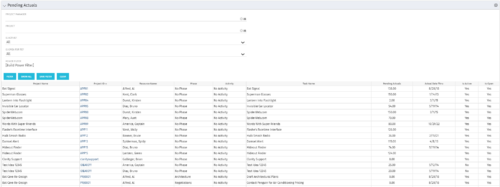 The Pending Actuals portlet displays pending actuals for resources by task. This portlet allows the user to filter on Project, Project Manager, Is Active and Is Open for Time Entry. This portlet provides Resource Managers and Project Managers a simple way to analyse which actuals have been submitted but not posted on specific tasks, as well as the aggregate pending hour total. Note: the information displayed is dependent on what the user has security rights to view.
 -
The Pending Actuals portlet displays pending actuals for resources by task. This portlet allows the user to filter on Project, Project Manager, Is Active and Is Open for Time Entry. This portlet provides Resource Managers and Project Managers a simple way to analyse which actuals have been submitted but not posted on specific tasks, as well as the aggregate pending hour total. Note: the information displayed is dependent on what the user has security rights to view.
-
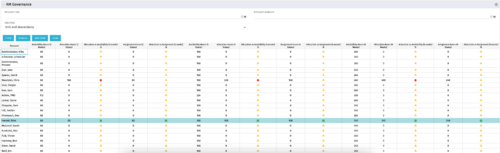 The RM Governance portlet provides resource availability, allocation, and comparison of the two values at 2, 4, and 8-week intervals. Allows searching on any RM or resource OBS instead of pre-filtering for the logged in user.
 -
The RM Governance portlet provides resource availability, allocation, and comparison of the two values at 2, 4, and 8-week intervals. Allows searching on any RM or resource OBS instead of pre-filtering for the logged in user.
-
The RM Governance portlet provides resource availability, allocation, and comparison of the two values at 2, 4, and 8-week intervals. Allows searching on any RM or resource OBS instead of pre-filtering for the logged in user.
-
 The My Resource Vacation portlet allows a resource to view the current logged in users' annual vacation allowance, as set by the resource manager, against the resource vacation calendar hours and actual posted timesheet hours. The portlet is useful for determining the amount of hours a resource has requested off and has remaining. The portlet also ensures the resource has accounted for all annual vacation allowance hours in the calendar and has posted time for all past calendar request hours.
 -
The My Resource Vacation portlet allows a resource to view the current logged in users' annual vacation allowance, as set by the resource manager, against the resource vacation calendar hours and actual posted timesheet hours. The portlet is useful for determining the amount of hours a resource has requested off and has remaining. The portlet also ensures the resource has accounted for all annual vacation allowance hours in the calendar and has posted time for all past calendar request hours.
-
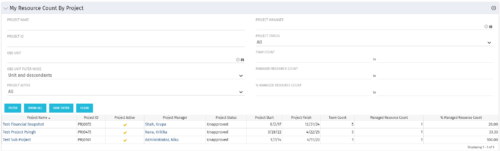 The My Resource Count by Project portlet displays project information, total team count and the current user’s resource count assigned to each project. The user may narrow the results by filtering on project name, manager, status, team count, managed resource count or percentage managed resource count. Using this portlet, resource managers can quickly identify which projects their resources are allocated to without having to navigate to each resource individually. Not only does this portlet display the overall team count on the project (team count), but it also displays the managed resource count (logged in user’s number of resources allocated to the project) as well as the percentage of managed resource count to team count.
 -
The My Resource Count by Project portlet displays project information, total team count and the current user’s resource count assigned to each project. The user may narrow the results by filtering on project name, manager, status, team count, managed resource count or percentage managed resource count. Using this portlet, resource managers can quickly identify which projects their resources are allocated to without having to navigate to each resource individually. Not only does this portlet display the overall team count on the project (team count), but it also displays the managed resource count (logged in user’s number of resources allocated to the project) as well as the percentage of managed resource count to team count.
-
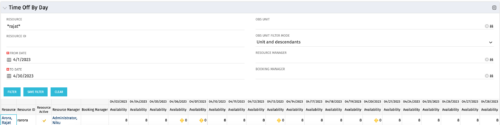 The Time Off by Day portlet displays resource availability by day. The portlet results may be filtered on: Resource Manager, Booking Manager, Resource, OBS Unit, and Date Range. This portlet will display the availability for each resource by day in separate columns and obtains the information from the time slices. When the portlet encounters an exception day (personal day off, or holiday on the base calendar), a yellow caution icon will appear within the same cell. Using this portlet, resource managers are able to quickly determine availability for their resources over a set time range.
 -
The Time Off by Day portlet displays resource availability by day. The portlet results may be filtered on: Resource Manager, Booking Manager, Resource, OBS Unit, and Date Range. This portlet will display the availability for each resource by day in separate columns and obtains the information from the time slices. When the portlet encounters an exception day (personal day off, or holiday on the base calendar), a yellow caution icon will appear within the same cell. Using this portlet, resource managers are able to quickly determine availability for their resources over a set time range.
-
 The Dashboard: Project Status Single-line portlet gives an overview of the project overall status as well as the status indicators on the "current" status report object. The portlet will pull the "id" from the page it is placed on, so this portlet is usually placed on the project dashboard tab. This portlet displays the report date, symbols relating to the overall status, scope, schedule, cost/effort, and the overall explanation across a single line in the portlet.
 -
The Dashboard: Project Status Single-line portlet gives an overview of the project overall status as well as the status indicators on the "current" status report object. The portlet will pull the "id" from the page it is placed on, so this portlet is usually placed on the project dashboard tab. This portlet displays the report date, symbols relating to the overall status, scope, schedule, cost/effort, and the overall explanation across a single line in the portlet.
-
 The Dashboard: Project Information portlet gives a set of high-level information about the project. The portlet will pull the "id" from the page it is placed on, so this portlet is usually placed on the project dashboard tab. The portlet displays the name, project ID, project manager, description, start date, finish date, baseline start, and baseline finish.
 -
The Dashboard: Project Information portlet gives a set of high-level information about the project. The portlet will pull the "id" from the page it is placed on, so this portlet is usually placed on the project dashboard tab. The portlet displays the name, project ID, project manager, description, start date, finish date, baseline start, and baseline finish.
-
The Dashboard: Project Status Single-line portlet gives an overview of the project overall status as well as the status indicators on the "current" status report object. The portlet will pull the "id" from the page it is placed on, so this portlet is usually placed on the project dashboard tab. This portlet displays the report date, symbols relating to the overall status, scope, schedule, cost/effort, and the overall explanation across a single line in the portlet.
-
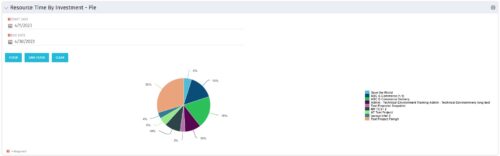 The Resource Time by Investment - Pie portlet shows a graphical representation of the time spent on investments for all resources where the logged in user is selected as the resource manager. The portlet gives the Resource Manager the ability to quickly view all time reported by resources against projects. The portlet filters between specific dates using the daily actuals timeslice. The pie chart provides a graphical view as to how time is divided across projects.
 -
The Resource Time by Investment - Pie portlet shows a graphical representation of the time spent on investments for all resources where the logged in user is selected as the resource manager. The portlet gives the Resource Manager the ability to quickly view all time reported by resources against projects. The portlet filters between specific dates using the daily actuals timeslice. The pie chart provides a graphical view as to how time is divided across projects.
-
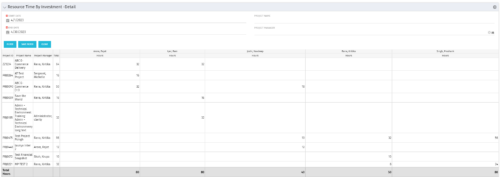 The Resource Time by Investment Detail portlet gives the Resource Manager the ability to search for time reported by resources against investments. The portlet provides filters for specific dates, a particular project and/or Project Manager. Using this portlet, the RM can get an overview of all data in a time period, the overall time logged to a project and the breakdown of his or her resources’ hours on that project.
 -
The Resource Time by Investment Detail portlet gives the Resource Manager the ability to search for time reported by resources against investments. The portlet provides filters for specific dates, a particular project and/or Project Manager. Using this portlet, the RM can get an overview of all data in a time period, the overall time logged to a project and the breakdown of his or her resources’ hours on that project.
-
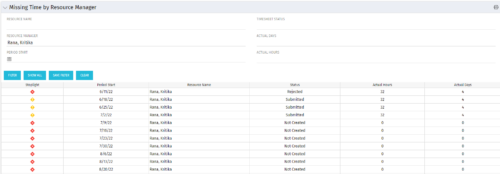 The Missing Time by RM portlet displays all missing or late timesheets for resources for which the logged in user has resources (logged in user is the RM). Resources will be listed if they are open for time entry, have a track mode of Clarity, and have timesheet that is not posted (accommodates for hire and termination dates). Resource managers may use this portlet to determine the timesheet status of all resources in open time periods. The portlet will display an indicator based on timesheet status, the status, period start, resource name, and actual hours for the timesheet.
 -
The Missing Time by RM portlet displays all missing or late timesheets for resources for which the logged in user has resources (logged in user is the RM). Resources will be listed if they are open for time entry, have a track mode of Clarity, and have timesheet that is not posted (accommodates for hire and termination dates). Resource managers may use this portlet to determine the timesheet status of all resources in open time periods. The portlet will display an indicator based on timesheet status, the status, period start, resource name, and actual hours for the timesheet.
-
 Does your organization struggle with resource management? Have you considered creating a Resource Management Office (RMO)? This session will review how some organizations are using RMOs to drive adoption and effectively manage resources, including real world examples of RMO setup and execution.
 -
 Are you starting a resource management implementation, or do you want to compare how you are using these functions vs. others or best practices? In this class we will discuss some best practices from successful customers.
 -
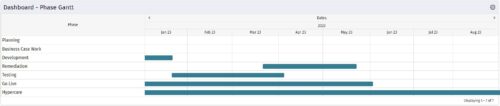 The Dashboard: Phase Gantt portlet gives an overview of all WBS level 1 tasks or milestones for a single project. The portlet will pull the "id" from the page it is placed on, so this portlet is usually placed on the project dashboard tab. The portlet displays the name, and a graphical representation of the timeline for the phases. The date range may be configured by day, month, year, or quarter. The start date may also be configured to any date or a relative date (start of current month, start of next year, etc).
 -
The Dashboard: Phase Gantt portlet gives an overview of all WBS level 1 tasks or milestones for a single project. The portlet will pull the "id" from the page it is placed on, so this portlet is usually placed on the project dashboard tab. The portlet displays the name, and a graphical representation of the timeline for the phases. The date range may be configured by day, month, year, or quarter. The start date may also be configured to any date or a relative date (start of current month, start of next year, etc).
-
The Dashboard: Phase Gantt portlet gives an overview of all WBS level 1 tasks or milestones for a single project. The portlet will pull the "id" from the page it is placed on, so this portlet is usually placed on the project dashboard tab. The portlet displays the name, and a graphical representation of the timeline for the phases. The date range may be configured by day, month, year, or quarter. The start date may also be configured to any date or a relative date (start of current month, start of next year, etc).
