-
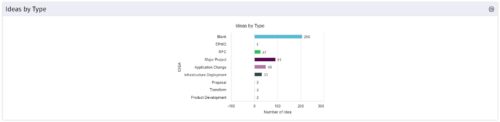 This is a great way to review demand by type and evaluate where demand is coming from and who will be impacted. Displays a bar graph of all ideas group by type. Provides the ability to drill down into a bar to see which ideas are part of the bar.
 -
This is a great way to review demand by type and evaluate where demand is coming from and who will be impacted. Displays a bar graph of all ideas group by type. Provides the ability to drill down into a bar to see which ideas are part of the bar.
-
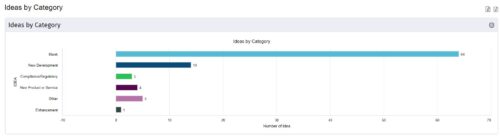
 This is a great way to review demand by type and evaluate where demand is coming from and who will be impacted. Displays a bar graph of all ideas group by type.
 -
This is a great way to review demand by type and evaluate where demand is coming from and who will be impacted. Displays a bar graph of all ideas group by type.
-
This is a great way to review demand by type and evaluate where demand is coming from and who will be impacted. Displays a bar graph of all ideas group by type.
-
 You can’t wait, integrate! Clarity is highly capable of being the center of a hub and spoke ecosystem for your project delivery. With flexible integration options and robust portfolio reporting and decision support functionality, Clarity will help you consolidate data from multiple systems of record into one source of truth. Join this class to see common use cases for optimizing a PPM delivery value stream that cuts across a diverse suite of applications, including HR, Finance, ITSM, Agile, Work Management, and many more.
 -
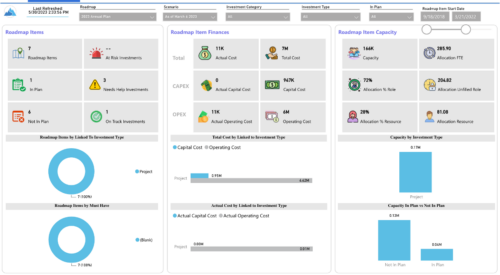
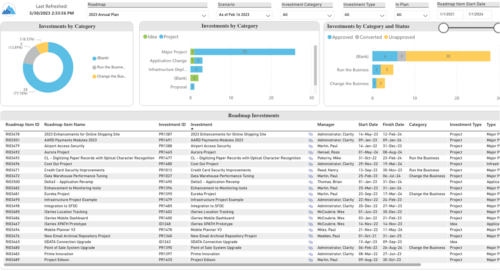 Plan your future work by comparing different scenarios, including in-flight work, and determine the best course of action for your organization. Report Views include: • Roadmap Details • Resource Investment Demand • Roadmap Financials • Roadmap Investment Gantt • Roadmap Item Gantt • Roadmap Overview – Default Scenarios • Roadmap Overview – Single Roadmap Selection • Scenario Comparison Demo Video - https://www.youtube.com/watch?v=RjdvrRd4ZG0&list=PLXJ5ktuWV0jiS9CvBpHvBIwpKPmA9uvwK&index=7
 -
 Plan your future work by comparing different scenarios, including in-flight work, and determine the best course of action for your organization. Report Views include:
- Roadmap Details
- Resource Investment Demand
- Roadmap Financials
- Roadmap Investment Gantt
- Roadmap Item Gantt
- Roadmap Overview – Default Scenarios
- Roadmap Overview – Single Roadmap Selection
- Scenario Comparison
-
 Lean Portfolio Management (LPM) is one of the most researched and in demand topics for modern enterprises. Come learn what LPM is, key LPM practices and roles needed for success, and how Clarity and Rally provide end to end visibility from strategy to execution.
 -
 Lean Portfolio Management (LPM) is one of the most researched and in demand topics for modern enterprises. Come learn what LPM is, key LPM practices and roles needed for success, and how Clarity and Rally provide end to end visibility from strategy to execution.
 -
 Lean Portfolio Management (LPM) is one of the seven SAFe components of the Lean Enterprise. LPM helps organizations solve numerous challenges by decreasing the delivery of time to value, enabling the organization to pivot quickly in ever-shifting markets, and more.
 -
 London Stock Exchange shares their Clarity journey (since 2008) and where they want to take the tool next. Current goals are: • Moving toward standardized ways of working. Focused on connecting our ecosystem of tools with Clarity as a focal point for Portfolio Management and SPM. • With an end goal of Faster Time to Market, on a journey to be a Customer Lead organization.
 -
 A Quick Reference Guide to assist in managing a Custom Investment in Clarity’s Modern UX. Reviews accessing the Custom Investment Link and navigating the tabs.
 -
 Rego’s training materials for Managing Portfolios in Clarity. The slide deck was put together using Clarity version 15.4.1. This course will describe how to:
- Organize Portfolios
- Define Portfolio Properties
- Build Portfolio Contents and Synchronization
- Define Portfolio Targets
- Utilize the Portfolio Waterline
- Ranking Investments
- Scenario Planning
- Portfolio Analysis and Outputs
-
 How do I mature my portfolio planning? What is my organization's next steps in maturing our portfolio planning processes, and how can CA PPM or other tools help? This class will review industry trends related to portfolio planning and talk about what each organization should aspire to portfolio processes.
 -
 Aligning work to organizational strategy is a fundamental requirement in today’s ever-changing marketplace. High-performing organizations, however, are moving beyond basic connections to introduce strategic hierarchies that are tied at various levels to real measurements of business value via Objectives and Key Results (OKRs). Join our Guides as they present key concepts, best practices, and the evolution of strategic alignment.
 -
 Are you on an older version of CA PPM? Do you want to understand the value of the new features and functions in recent versions? Have you seen the new UX and do you wonder when is the right time to move over? This class is a demonstration of the new UX, new features in both classic and new UX, and the value of these features for customers.
 -
 A review of how Northern Trust integrates financial systems with Clarity PPM bilaterally, providing the Finance organization crucial information, and NT Project Managers with a birds-eye view of project financials. Utilizing the Rego Data Extractor and the Rego Data Processor, these information exchanges help Portfolio and Project Managers eliminate their manual and redundant efforts, solidify their overall data accuracy, and dramatically improve the content provided to their Execs for decision-making.
 -
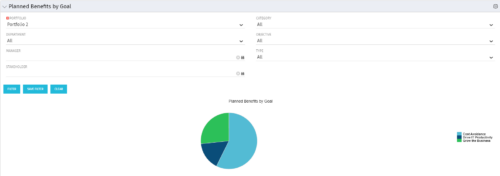 Part of the Business Transformation Package, this pie chart portlet shows planned benefits across the system grouped by Goal. The data is displayed form the investments in a portfolio. The portlet lets the Portfolio Manager know on which GOAL the planned benefit is allocated, so as to target the overall investment spread in the portfolio.
 -
Part of the Business Transformation Package, this pie chart portlet shows planned benefits across the system grouped by Goal. The data is displayed form the investments in a portfolio. The portlet lets the Portfolio Manager know on which GOAL the planned benefit is allocated, so as to target the overall investment spread in the portfolio.
-
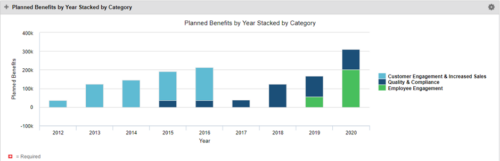 This Portlet starts by pulling Active Investments from a Classic UI Portfolio. It then looks for the Cost Plan of Record and its’ linked Benefit Plan. It then aggregates the Planned Benefit and groups it by Category, then presents a stacked bar chart.
 -
This Portlet starts by pulling Active Investments from a Classic UI Portfolio. It then looks for the Cost Plan of Record and its’ linked Benefit Plan. It then aggregates the Planned Benefit and groups it by Category, then presents a stacked bar chart.
-
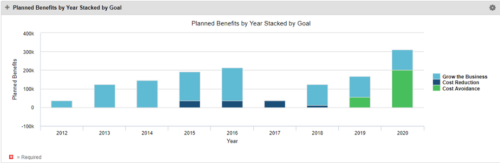 This Portlet starts by pulling Active Investments from a Classic UI Portfolio. It then looks for the Cost Plan of Record and its’ linked Benefit Plan. It then aggregates the Planned Benefit and groups it by Goal, then presents a stacked bar chart.
 -
This Portlet starts by pulling Active Investments from a Classic UI Portfolio. It then looks for the Cost Plan of Record and its’ linked Benefit Plan. It then aggregates the Planned Benefit and groups it by Goal, then presents a stacked bar chart.
-
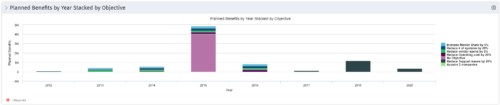 This Portlet starts by pulling Active Investments from a Classic UI Portfolio. It then looks for the Cost Plan of Record and its’ linked Benefit Plan. It then aggregates the Planned Benefit and groups it by Objective, then presents a stacked bar chart.
 -
This Portlet starts by pulling Active Investments from a Classic UI Portfolio. It then looks for the Cost Plan of Record and its’ linked Benefit Plan. It then aggregates the Planned Benefit and groups it by Objective, then presents a stacked bar chart.
-
 Course Description: Are you ready to implement a continuous improvement practice within your PMO? This class is a working session to help build and sustain a continuous assessment initiative within your PMO, helping to manage goals and objectives from start-up through maturity. We will also discuss growth mapping to processes, tools, and strategic objectives.
 -
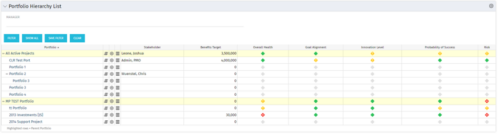 Part of the Business Transformation Package, this portlet displays the portfolios with hierarchy (child portfolio(s)). The portlet displays the basic portfolio fields like – manager, stakeholder, etc. A Metrics subpage can be created with the fields on the “Properties – Metrics.”. The fields: Overall Health, Goal Alignment, Innovation Level, Probability of Success are custom fields and can be configured on a subpage.
 -
Part of the Business Transformation Package, this portlet displays the portfolios with hierarchy (child portfolio(s)). The portlet displays the basic portfolio fields like – manager, stakeholder, etc. A Metrics subpage can be created with the fields on the “Properties – Metrics.”. The fields: Overall Health, Goal Alignment, Innovation Level, Probability of Success are custom fields and can be configured on a subpage.
-
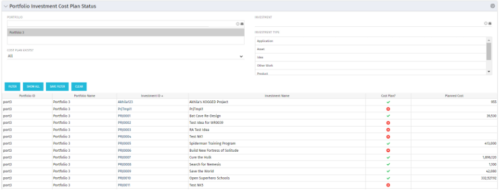 The portlet shows which investments within a portfolio has a cost plan and those that do not. For the ones which do have a cost plan, the Cost Plan? Field shows a Green checkmark. For the ones which do not have a cost plan, the Cost Plan? Field shows a Red cross.
 -
The portlet shows which investments within a portfolio has a cost plan and those that do not. For the ones which do have a cost plan, the Cost Plan? Field shows a Green checkmark. For the ones which do not have a cost plan, the Cost Plan? Field shows a Red cross.
-
The portlet shows which investments within a portfolio has a cost plan and those that do not. For the ones which do have a cost plan, the Cost Plan? Field shows a Green checkmark. For the ones which do not have a cost plan, the Cost Plan? Field shows a Red cross.
-
 A slide deck from Rego’s training class on Portfolio Management using Clarity’s Classic UX. Covers an introduction to Portfolio Management including definition, portfolio contents, PfM roles and responsibilities, how portfolios work, data used, key deliverables, prerequisites for starting PfM, and PfM security.
 -
 Course Description: Do you want to understand the OOTB configuration and functionality of portfolio management? In this class, we will review the OOTB objects, views, and functions of portfolio management.


Copyright 2023 • Rego Consulting Corporation • Privacy Policy