-
 Course Description: This class will provide a list of daily and weekly activities that every resource manager should follow to leverage Clarity PPM more effectively.
 -
 Course Description: Have you ever wanted to build portlets that were not limited by Clarity PPM's out-of-the-box portlet types? This class will explore some of the options you can use to build helpful portlets with HTML, including calendars, Kanban boards, tile-based project lists, and some special Star Wars-themed communication portlets.
 -
 Do you want to understand the OOTB configuration and functionality of roadmap management? In this class, we will review the OOTB objects, views, and functions of roadmap management.
 -
 This training document is a Rego Consulting Quick Reference Guide to assist with the management of Roadmap items within the Grid View in Clarity’s Modern User Experience. This doc references version 16.1 views. Instructions are provided to help users add and remove columns, move columns, pin columns and sort rows of data. The document provides guidance on how to use the View Options function to manage Per-Period Metrics. Includes guidance on how to update Roadmap data from the Grid View and how to use the In Plan column to rank investments.
 -
 A presentation slide deck from Rego University 2022. A course outline document reviewing the innovative offerings from Rego. This course reviewed RegoXchange, Action Item Responder, Excel Data Manager, and innovations around Office 365.
 -
 A presentation slide deck from Rego University 2022. This document is course material for an Advanced Admin class for Clarity’s Modern UX. Focus on this class was on Blueprints.
- A presentation slide deck from Rego University 2022. This document is course material for an Advanced Admin class for Clarity’s Modern UX. Focus on this class was on Blueprints.
- Pages
- Modules - Channels
- Rules
- Fields Level Security
- Actions
- A presentation slide deck from Rego University 2022. This document is course material for an Advanced Admin class for Clarity’s Modern UX. Focus on this class was on Blueprints.
-

 A presentation slide deck from Rego University 2022. Presentations by Erie Insurance, University of California, San Francisco, and The Hershey Company.
 -
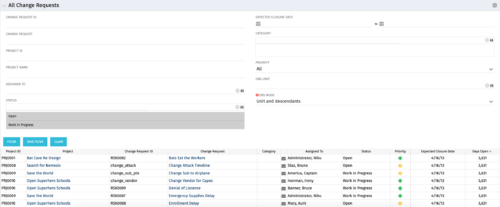 The All Change Request portlet displays all change requests related to active projects that the logged in user has view rights to. The portlet provides the project manager a single place to view change requests across multiple projects without having to go into each project individually and allows for more efficient management and reporting across projects. The filter allows the user to narrow their search by date ranges, resources involved, and/or the project with which the Change Request is associated. Other alternatives for filtering include the category, priority or status of the Change Request. In the list view, a status is displayed for each Change Request (CR), along with the Project with which the CR is associated, the CR ID, the CR name, the resource to whom the CR is assigned, Priority, Expected Closure Date, and number of days the CR has remained open. Note: Only the projects that the user has viewer rights to will show up in the list.
 -
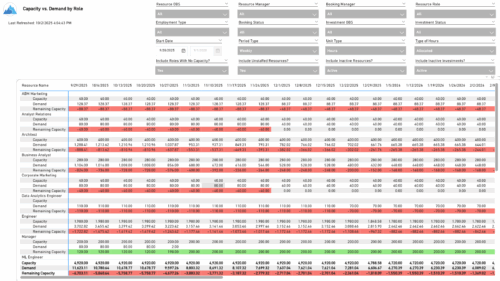 The Capacity vs. Demand by Role report provides visibility into resource utilization by comparing available capacity to actual demand across investments at the role level. It highlights capacity, demand, and remaining capacity, helping identify potential surpluses or shortfalls. Data can be viewed by week or month and displayed in either hours or full-time equivalents (FTEs) to support detailed workforce planning and analysis.
 -
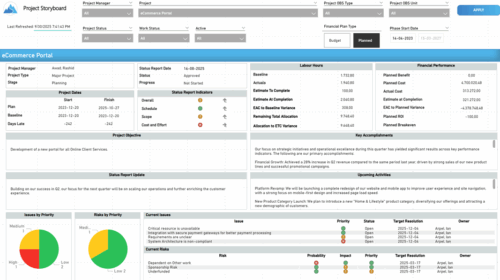 The Time Compliance report displays different frame in the displaying project information such as project dates, project objective, the amount, and cost of resources that are planned and actual, key accomplishments, upcoming activities, current issues and risks, and the project progress toward goals, and some EVM indicators for its phases.
 -
 This class is a hands-on beginner training class on Clarity's native functionality for reporting. Learn how to build basic visuals/reports and leverage Canvas to get the most out of Clarity.
 -
 Learn how to use, and follow best practices with the Clarity REST APIs - Execute a REST Call - Create JSON payloads and parse JSON responses - Capture the result of the request
 -
 This training document is a Rego Consulting Quick Reference Guide to assist with the creation of Benefit Plans in Clarity’s Modern User Experience. This doc references version 16.2.1 views. Doc provides detail on how to create a Benefit Plan, how to categorize Benefit Class and Benefit Subclass, how to add financial values to your Benefit Plan, and how to add the Benefit Plan to your Cost Plan.
 -
This training document is a Rego Consulting Quick Reference Guide to assist with the creation of Risks, Issues and Changes in Clarity’s Modern User Experience. This doc references version 16.2.1 views. Doc covers creating and management of these project tools.
-
This training document is a Rego Consulting Quick Reference Guide to assist with Entering and Submitting Time in Clarity’s Modern User Experience. This doc references version 16.2.1 views. Document includes Accessing & Selecting Timesheets, Populate Timesheet, Updating Timesheet, Submitting Timesheet and Entering Time for Someone Else.
-
 This training document is a Rego Consulting Quick Reference Guide to assist with the utilization of the My Workspace area within Clarity’s Modern User Experience. This doc references version 16.2.1 views. Document reviews Checklists, Smartlists and To Do’s.
 -
 This training document is a Rego Consulting Quick Reference Guide to assist with General Navigation in Clarity’s Modern User Experience. This doc references version 16.1.2 views. Doc reviews the Menu Bar and User Tool Bar. Document provides instructions on how to access blueprints, create a new blueprint and edit the fields available on the blueprint. Detail is also provided on how to update the modules, rules and actions associated with a blueprint. Instructions are listed to show the user how to modify the create from template page, how to add a new channel and how to set a default blueprint. Tips on the user of the API Attribute ID are also provided.
 -
 This training document is a Rego Consulting Quick Reference Guide to assist with Staff Grid in Clarity’s Modern User Experience. This doc references version 16.1.2 views. Document provides detail on the use of the Staff Grid in the Staffing Modules in the Common Component functionality.
 -
 This training document is a Rego Consulting Quick Reference Guide to assist with the adding of resources to the Staff tab for Ideas in Clarity’s Modern User Experience. This doc references version 16.1.2 views. Document provides detail on how to add resources to the Staff tab, Default Allocation % and Per-Period metrics.
 -
 This training document is a Rego Consulting Quick Reference Guide to assist with Time Entry Administration Settings for Timesheets. This doc references version 16.1.2 views. Document provides detail on Timesheet Options for the Modern UX and how to enable end user column configuration. Detail is also provided on how end users may configure their timesheet view.
 -
 This training document is a Rego Consulting Quick Reference Guide to assist with the utilization of the My Workspace area within Clarity’s Modern User Experience. This doc references version 16.1.2 views. Document reviews Checklists, Smartlists and To Do’s.
 -
 "Ensure you are keeping tabs on your Clarity environment. Clarity has key components that require monitoring to ensure consistent processing: - identify key modules like processes, jobs, financials, among others - identify customizations and common errors that can be improved"
 -
 Do you want to know more about building integrations quickly and easily? We will also show Rego's data processor and extraction tool and how it can be used for all outbound file based integrations to save money and time.
 -
 Does your organization struggle with resource management? Have you considered creating a Resource Management Office (RMO)? DO you struggle with a lack of Executive sponsorship to drive adoption? This session will review how some organizations are succeeding in driving adoption and effectively manage resources through engaging leadership, RMOs, and using more dedicated resources. Learn about some best practices for driving effective resource management across your organization.
 -
 Lean Portfolio Management (LPM) is one of the seven SAFe components of the Lean Enterprise. LPM helps organizations solve numerous challenges by decreasing the delivery of time to value, enabling the organization to pivot quickly in ever-shifting markets, and more.
 -
 This document will walk the user through step by step on how to utilize the new pages functionality in the modern UX to link to the classic dashboard without showing the classic UI menus.
 -
 This training document is a Rego Consulting Quick Reference Guide to assist with the use of Sub-Objects and Channels in Clarity’s Modern UX.
 -
 This training document is a Rego Consulting Quick Reference Guide to assist with Status Reporting in Clarity’s Modern User Experience. The document reviews Status Reporting via the Status Tab and the Status Reporting Tab – Grid View.
 -
 This training document is a Rego Consulting Quick Reference Guide to assist with the population of project properties in Clarity’s Modern User Experience. Documents starts with accessing the project via the Tile module. Then shows how to update properties in the Details page and in the Project List.
 -
 This training document is a Rego Consulting Quick Reference Guide to assist with use of the Task List Tab to manage project tasks in Clarity’s Modern User Experience. Document reviews the Task List Tab, and the Task Tab Sub Tabs.
 -
 A .pdf file that has the slide by slide presentation at 2015 RegoU on the elements of Financial Processing in CA PPM. The agenda covers a financial process overview, enabling time reporting, enabling financials, posting timesheets, transaction entries, posting to WIP, adjustments, importing financial actuals, and job scheduling.
 -
 Resource Management - Are You Doing it Right? Companies of all shapes and sizes need to know if they have the right people working on the right things at the right time, to meet their objectives. Rego's own Grant Zemont has put together this report to help your company learn the best practices for setting up a resource management office correctly. Download the free report here. This White Paper is downloaded from the Rego Consulting site. You will be asked to provide your email address and current ppm tool. - http://info.regoconsulting.com/rmo-report ** Do not Add to Cart - No Downloadable File**
 -
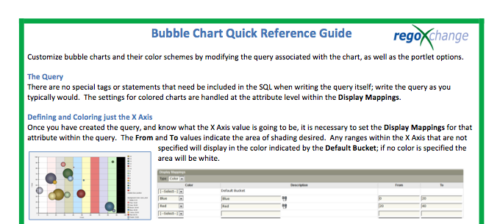 The Bubble Chart Quick Reference Guide provides the user instructions to customize bubble charts and their color schemes by modifying the query associated with the chart, as well as the portlet options. This is very beneficial as it allows the user to match or blend colors among all of the bubble portlets to better display the information the portlets are delivering. Similar data can be one color while different data can be its own color to better show the overall picture.
 -
 Course description: “How are other companies storing or managing documents? This session will discuss options for using native CA PPM, linking to SharePoint, connecting directly to SharePoint, using Google docs, as well as other options. This session will also discuss options for document approval workflows within CA PPM for both collaborative documents and attachment fields.” Download file is the slide deck used during the presentation.
 -
 Course Description: For clients that have both ServiceNow and Clarity PPM, passing information between the systems becomes vital for the enterprise with ITSM, demand, and PPM toolsets. One of the biggest areas of interaction is around demand management. Come and see Rego's integration solution, which flexibly allows for ServiceNow records (incident, problem, idea, enhancement, and demands) to generate Clarity PPM ideas or projects.
 -
 Do you want to add REST interfaces to your Clarity instance? We’ll walk you through specific custom interface examples in GEL and showcase Rego’s Data Processor REST capabilities you can leverage to reduce the time and cost of implementation.


Copyright 2023 • Rego Consulting Corporation • Privacy Policy