-
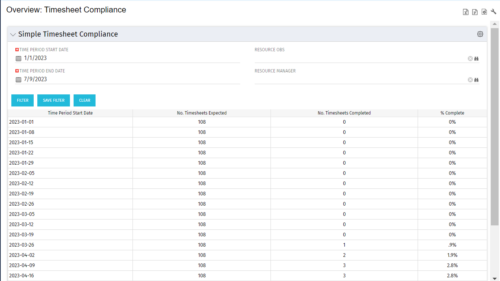 This portlet provides a view into the number of timesheets that were expected to be completed for a specified time period(s) as well as the number of timesheets that were completed and the percent complete. This can also be filtered by OBS so that a company can see timesheet compliance at the OBS level.
 -
This portlet provides a view into the number of timesheets that were expected to be completed for a specified time period(s) as well as the number of timesheets that were completed and the percent complete. This can also be filtered by OBS so that a company can see timesheet compliance at the OBS level.
-
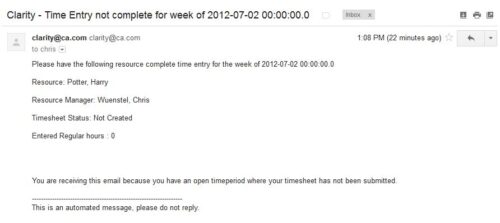 The Time Tracking Stalker – Resource workflow process is used to notify resources that fail to submit a timesheet in a prior week. The workflow checks for active resources, hire/termination dates, track mode, and open for time entry. This process helps to ensure resources submit timesheets in a timely manner. In version 13, the email can be enhanced to include colors, bold, underline, and other HTML formatting.
 -
The Time Tracking Stalker – Resource workflow process is used to notify resources that fail to submit a timesheet in a prior week. The workflow checks for active resources, hire/termination dates, track mode, and open for time entry. This process helps to ensure resources submit timesheets in a timely manner. In version 13, the email can be enhanced to include colors, bold, underline, and other HTML formatting.
-
 Is there a way to simplify time tracking? Time is a function 90% of companies use. What are ways to have time be less of a burden to users? How can you minimize the negative perception? This session will discuss options within CA PPM or outside CA PPM to make time tracking less of a burden for all.
 -
 A slide deck that reviews the processes for time entry and approval of timesheets in Clarity’s Modern UX. Used for Rego’s training engagements, it covers the Time Entry process via flow chart, steps for submitting a timesheet, adjusting a returned timesheet, and adding or removing tasks from a timesheet.
 -
 The Time Compliance Detail report displays the timesheet status by resource, their email, employment type, and resource manager, in their respective OBS.
 -
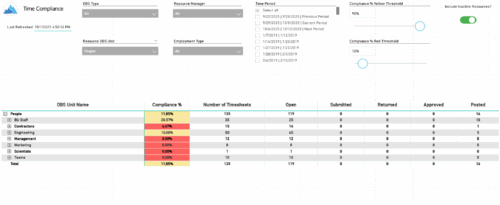 The Time Compliance report displays the timesheet compliance percent, the number of timesheets by status (open, submitted, returned, approved, and posted), and the total for each OBS unit, with the ability to filter and drill down.
 -
 The Time By Type - Pie Chart portlet is a graphical representation of time by type of investment for all resources the logged in user has security rights to view. This portlet pulls from the daily timeslices, and can be used for determining what types of projects receive the majority of hours. The filter option allows for entry of a specific start date and finish date.
 -
The Time By Type - Pie Chart portlet is a graphical representation of time by type of investment for all resources the logged in user has security rights to view. This portlet pulls from the daily timeslices, and can be used for determining what types of projects receive the majority of hours. The filter option allows for entry of a specific start date and finish date.
-
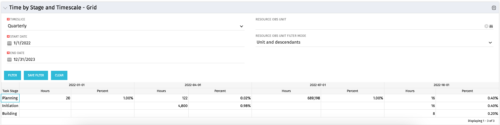 The Time by Stage and Timescale – Grid portlet displays hours for all tasks on projects by their stage for a user-defined time period. The user may narrow the results by time scale, resource OBS unit, and dates. The portlet not only provides the total hours per stage, but also the percentage of time spent on each task type. This portlet pulls data from the timeslices. Using this portlet, management can determine if excess time is being spent on a certain task stage within a project.
 -
The Time by Stage and Timescale – Grid portlet displays hours for all tasks on projects by their stage for a user-defined time period. The user may narrow the results by time scale, resource OBS unit, and dates. The portlet not only provides the total hours per stage, but also the percentage of time spent on each task type. This portlet pulls data from the timeslices. Using this portlet, management can determine if excess time is being spent on a certain task stage within a project.
-
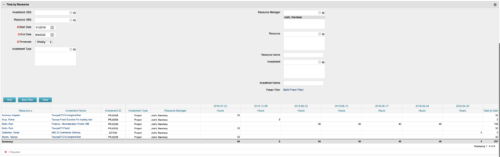 This portlet displays the actual hours resources entered against investments. The per-period actual hours can be showed in days, weeks, months, quarters, or years. The data can be filtered by Resource, Resource Manager, OBS Unit, Investment and time period
 -
This portlet displays the actual hours resources entered against investments. The per-period actual hours can be showed in days, weeks, months, quarters, or years. The data can be filtered by Resource, Resource Manager, OBS Unit, Investment and time period
-
This portlet displays the actual hours resources entered against investments. The per-period actual hours can be showed in days, weeks, months, quarters, or years. The data can be filtered by Resource, Resource Manager, OBS Unit, Investment and time period
-
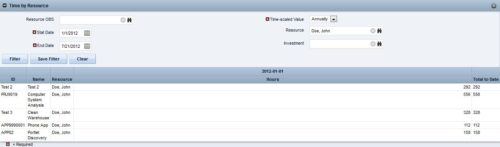
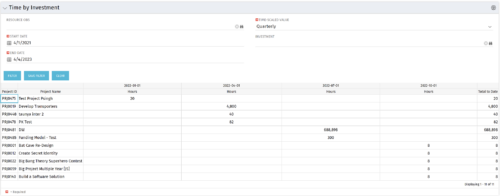
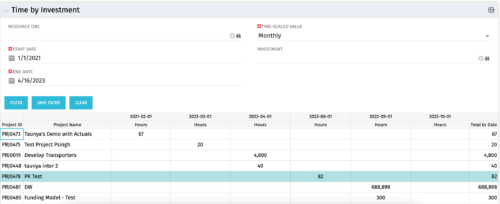 The Time by Investment portlet displays time logged to investments for all investments the logged in user has security rights to view using data from timeslices. It is capable of displaying the data by annual, quarterly, monthly, weekly, and daily segments with totals per date also being presented. The portlet may can be filtered by investment, resource OBS, and time segments. This portlet can be used as a management and governance tool to review aggregate hours posted to investments by time period.
 -
The Time by Investment portlet displays time logged to investments for all investments the logged in user has security rights to view using data from timeslices. It is capable of displaying the data by annual, quarterly, monthly, weekly, and daily segments with totals per date also being presented. The portlet may can be filtered by investment, resource OBS, and time segments. This portlet can be used as a management and governance tool to review aggregate hours posted to investments by time period.
-
 The Time by Investment portlet displays time logged to investments for all investments the logged in user has security rights to view using data from timeslices. It is capable of displaying the data by annual, quarterly, monthly, weekly, and daily segments with totals per date also being presented. The portlet may can be filtered by investment, resource OBS, and time segments. This portlet can be used as a management and governance tool to review aggregate hours posted to investments by time period.
 -
 ** No Download - Do not Add to Cart ** One thing that impacts a successful project outcome more than anything else is the people resourced to do the work. Yet Resource Management is often the last part of Clarity PPM to be used because users can view it as complicated and intimidating. It doesn’t need to be. In this webinar, Rego’s expert guide Michelle Merriam-Day will walk you through the three key components to successfully using Resource Management in your organization: - Quantify your capacity - Establish investment-level demand - Leverage foundational view for analysis. There is no download for this content. Follow the link to view - http://info.regoconsulting.com/3-steps-basic-resource-management-april-2021
 -
 A presentation slide deck from Rego University 2022. A class about the goal of TCO and what it takes to achieve it.
- TCO Benefits
- Best Practices
- Deployment Tips
-
 Most organizations struggle with collaborating across frameworks. Those managing FinOps activities, the TBM office, and Agile delivery teams are operating in silos, but there is a better way forward. In this class we’ll go through some strategies of bringing teams together to improve business outcomes through collaboration.
 -
 How do you address ever-growing backlogs and impatient demands from internal or external customers, while also balancing the desire to innovate with the need to maintain high performance and quality? This session focuses on proven techniques - learned over several years and iterations - to help win the battle against these challenges.
 -
 Join this session for best practices in optimizing Clarity's Modern UX modules. Learn how - and when - to use specific modules in Clarity (roadmaps vs hierarchies, CITs vs Projects, etc.). Let’s really dive into the power and adaptability of Modern UX features, through the lens of finding the best fit to meet the needs of your end users and business processes.
 -
 Join this session to learn best practices of when to use what module in Clarity (roadmaps vs hierarchies, CITs vs Projects...). Let’s really look at the power and adaptability of Modern UX features, through the lens of finding the best fit to meet the needs of your end users and business processes.
 -
 With its end-to-end capabilities and aggregated data, ValueOps is an ideal platform on which to build the ultimate AI for value stream management. In this must-see session, Jean-Louis Vignaud, Head of ValueOps, will outline his vision of how our next generation of AI features will help deliver curated visibility, guided alignment, and augmented efficiency to the enterprise.
 -
 "The concepts of creativity are tools and habits that help you and your team become more creative. During this session, you will learn simple tricks and methods to encourage a more creative work environment. Join this session to learn how to structure an effective team meetings, workshops and all-inclusive ideation sessions. Even learn about some great work habits to boost your career! "
 -
 Course Description: The concepts of creativity are tools and habits that help you and your team become more creative. During this session, you will learn simple tricks and methods to encourage a more creative environment within your teams. Creativity training includes emotional intelligence and behavioral aspects, all-in-one.
 -
 A presentation slide deck from Rego University 2022. This document was used to facilitate a discussion and training around creativity in the workplace.
- What is Creativity?
- Why do we care about Creativity?
- Our personality types and behaviors
- Types of Thinking
- Using some tools
-
 Discover the benefits and functionality of Editable Tables in Apptio and how they can be leveraged to simplify and streamline Technology Business Management (TBM) processes. This session will delve into the new features and capabilities of Editable Tables, demonstrating unique methods for making your TBM experience more efficient and manageable. Expand your knowledge and master the art of Editable Tables and Reports in Apptio.
 -
 How do you prioritize work? In many organizations, the traditional forced ranking scale (1-x) alone just isn’t sufficient. There are financial and resource constraints to consider. We must also align with strategic objectives, OKRs, or business outcomes. So how do we go about creating a plan which layers in-flight and proposed work within all these considerations, to create a balanced and prioritized roadmap? How do you drive priorities without driving yourselves crazy? In this session, we will share best practices and lessons learned. You will get a hands-on exploration of a practical, realistic, and flexible approach for bringing all the pieces together to satisfy your organization's planning needs.
 -
 How do you prioritize work? In many organizations, the traditional forced ranking scale (1-x) alone isn’t sufficient. There are financial and resource constraints to consider. We must align with strategic objectives, OKRs, or business outcomes. So how do we go about creating a plan which layers in-flight and proposed work within all these considerations, to create a balanced and prioritized roadmap? How do you drive priorities without driving yourself crazy? In this session, we will share best practices and lessons learned. You will get a hands-on exploration of practical, realistic, and flexible approach to satisfy your organization’s planning needs.
 -
 The hit TV series Ted Lasso is well known for its humor and entertainment value, but hidden under the light-hearted banter are some important messages that leaders can take to heart. Join expert Agile guide, Tad Beaty, for a review of the first two seasons of the show. We’ll explore the messages that all leaders should take back to the office to improve engagement and make a better workplace.


Copyright 2023 • Rego Consulting Corporation • Privacy Policy