-
 Are you looking for some great examples of dashboards that include metrics/KPIs? This session will review a host of sample metric dashboards in use today that can spark ideas for you to implement in your company.
 -
 What integrations are the most requested and the most utilized? This class will review the most common interfaces to and from Clarity, including best practice use cases and lessons learned from real implementations.
 -
 Does your organization own Apptio or looking to purchase it? In this session we will dive into what Apptio is and how it complements your current Clarity solution.
 -
 Agile is here to stay, but waterfall may be as well. Companies around the world struggle with living in a bimodal development world, while trying to go through an agile transformation. This session will discuss best practices and lessons learned within companies that have gone through agile transformations. We will also review SAFe as a potential approach.
 -
 What should I expect to see within my organization related to PM over the next couple of years? How should I prepare my PMs, PMOs, or myself to embrace the new trends within the industry? This class will share Rego's observations on industry trends within PPM.
 -
 Have you looked in the regoXchange or reviewed Rego’s innovation offerings? This class will show you the power of Rego’s pre-built content library, integrations, and other assets. See example after example of portlets, processes, and materials you can use to add value to your instance of Clarity. Learn how you can introduce email-based approvals with Rego's action item responder. Get a peek at Rego's new MSP integration that avoids the issues faced with the OOTB integration. Finally, understand Rego's pre-built connectors and how they can benefit your instance. Including blueprint migrator. Include free tools like GEL builder, query, XOGbridge.
 -
 No matter how hard we try, many organizations cannot pry Excel out of the hands of project and resource managers. In this class we will explore possibilities that give up the battle and embrace Excel as a great data entry tool. We will show some neat case studies on quick Excel integrations deployed at customers.
 -
 “Real” Resource management is not for the faint of heart. To get a solid picture of the actual capacity multiple dimensions have to be considered: projects, daily business, absences, different work hours and more. In this session we will demonstrate how this can be done with the help of “Advanced Resource Planning” in Clarity. We will staff projects in seconds, simulate different options, jog new projects in and finally simulate the resource aspect of whole Roadmaps.
 -
 You are no longer regulated to the desktop browser to respond to action items. Learn how Rego solved this problem using just your email. We’ll talk about various use cases where you would get maximum benefit from a simple response on an action item directly from your email. It doesn’t matter if you are using email on your desktop, laptop, phone or tablet. The Action Item Responder as you covered.
 -
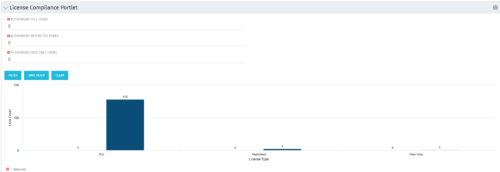 Portlet to quickly show License Compliance for all license types. Simply Enter your License Limits in the filter – The portlet will display the three license types in a grid format with compliance chart and RYG Icons.
 -
Portlet to quickly show License Compliance for all license types. Simply Enter your License Limits in the filter – The portlet will display the three license types in a grid format with compliance chart and RYG Icons.
-
Portlet to quickly show License Compliance for all license types. Simply Enter your License Limits in the filter – The portlet will display the three license types in a grid format with compliance chart and RYG Icons.
-
 Pie Chart Portlet displays counts of active projects with various Stale ratings. Calculation is Percent Stale Tasks = number of open (not completed) tasks with a finish date over 15 days old, divided by total open tasks. Filterable by OBS structure and project manager. Data label = project count. Mouse-over and Legend labels = stale rating. More than 90% Stale means 90 to 100% of open tasks on a project have finish dates older than 15 days. More than 71% Stale means 71 to 89% of open tasks on a project have finish dates older than 15 days. 0 - 70% Stale means fewer than 70% of open tasks on a project have finish dates older than 15 days.
 -
Pie Chart Portlet displays counts of active projects with various Stale ratings. Calculation is Percent Stale Tasks = number of open (not completed) tasks with a finish date over 15 days old, divided by total open tasks. Filterable by OBS structure and project manager. Data label = project count. Mouse-over and Legend labels = stale rating. More than 90% Stale means 90 to 100% of open tasks on a project have finish dates older than 15 days. More than 71% Stale means 71 to 89% of open tasks on a project have finish dates older than 15 days. 0 - 70% Stale means fewer than 70% of open tasks on a project have finish dates older than 15 days.
-
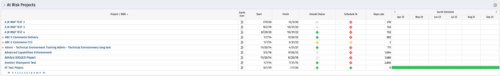 Part of the Business Transformation collection, this bar-chart portlet displays investments and (if exists) any child investments, which are at risk with regard to the schedule of the investments.
 -
Part of the Business Transformation collection, this bar-chart portlet displays investments and (if exists) any child investments, which are at risk with regard to the schedule of the investments.
-
 Part of the Business Transformation collection, this bar-chart portlet displays number of investments per stage. This provides a holistic overview of where the projects are within the organization.
 -
Part of the Business Transformation collection, this bar-chart portlet displays number of investments per stage. This provides a holistic overview of where the projects are within the organization.
-
Part of the Business Transformation collection, this bar-chart portlet displays number of investments per stage. This provides a holistic overview of where the projects are within the organization.
-
 Funnel Chart displays aggregated counts of Ideas by “Idea Progress”, a custom attribute. Chart shows Idea Progress names in legend, and count total is available as a mouse-over. No filters available on this portlet.
 -
Funnel Chart displays aggregated counts of Ideas by “Idea Progress”, a custom attribute. Chart shows Idea Progress names in legend, and count total is available as a mouse-over. No filters available on this portlet.
-
Funnel Chart displays aggregated counts of Ideas by “Idea Progress”, a custom attribute. Chart shows Idea Progress names in legend, and count total is available as a mouse-over. No filters available on this portlet.
-
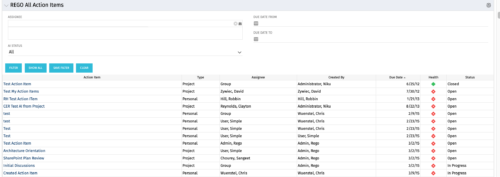 The All Action Items portlet provides detail on all actions items, including the name, type, assignee, status, due date, health indicator and creator of the action item. The portlet can be filtered by project, assignee, AI status, and due date range.
 -
The All Action Items portlet provides detail on all actions items, including the name, type, assignee, status, due date, health indicator and creator of the action item. The portlet can be filtered by project, assignee, AI status, and due date range.
-
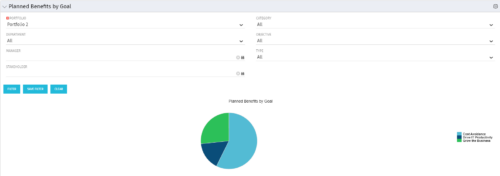 Part of the Business Transformation Package, this pie chart portlet shows planned benefits across the system grouped by Goal. The data is displayed form the investments in a portfolio. The portlet lets the Portfolio Manager know on which GOAL the planned benefit is allocated, so as to target the overall investment spread in the portfolio.
 -
Part of the Business Transformation Package, this pie chart portlet shows planned benefits across the system grouped by Goal. The data is displayed form the investments in a portfolio. The portlet lets the Portfolio Manager know on which GOAL the planned benefit is allocated, so as to target the overall investment spread in the portfolio.
-
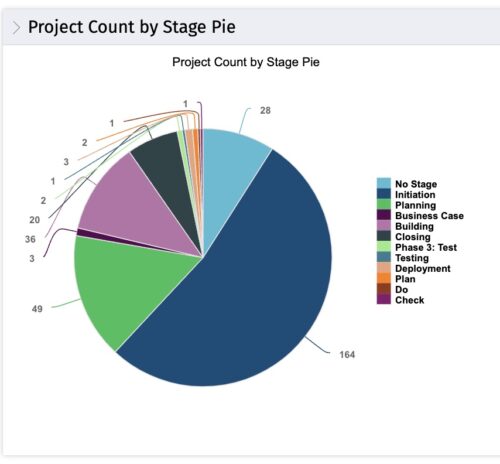 This portlet displays the projects by Stage in a pie chart. Every piece of the pie chart represents a stage of the Project Management methodology applied. The portlet also shows the number of projects on each stage. The legend displays all the different project stages appearing on the portlet. This portlet can be filtered to show only projects from a particular OBS unit or for a particular Project Manager.
 -
This portlet displays the projects by Stage in a pie chart. Every piece of the pie chart represents a stage of the Project Management methodology applied. The portlet also shows the number of projects on each stage. The legend displays all the different project stages appearing on the portlet. This portlet can be filtered to show only projects from a particular OBS unit or for a particular Project Manager.
-
 “Resources with No Basic Matrix Entry” portlet displays combinations of project and resource where the assigned resource does or does not have a rate established for that project. Portlet is filterable by Projects, Project ID, Resources, and Missing Rate (Yes, No, All). How does this work? The Rate Matrix Extraction job populates a record into the NBI_PROJ_RES_RATES_AND_COSTS table for every resource/project combination that meets any of the rate matrix criteria. This portlet checks that table, and sets the Missing Rate attribu
 -
“Resources with No Basic Matrix Entry” portlet displays combinations of project and resource where the assigned resource does or does not have a rate established for that project. Portlet is filterable by Projects, Project ID, Resources, and Missing Rate (Yes, No, All). How does this work? The Rate Matrix Extraction job populates a record into the NBI_PROJ_RES_RATES_AND_COSTS table for every resource/project combination that meets any of the rate matrix criteria. This portlet checks that table, and sets the Missing Rate attribu
-
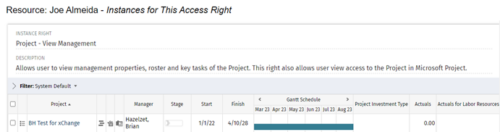
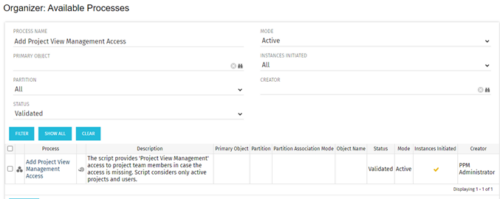 This process grants Project Management instance rights to all of the project team members within the program hierarchy. Allows users to view management properties, roster and key tasks of the project. This also allows user view access to the project in Microsoft Project.
 -
This process grants Project Management instance rights to all of the project team members within the program hierarchy. Allows users to view management properties, roster and key tasks of the project. This also allows user view access to the project in Microsoft Project.


Copyright 2023 • Rego Consulting Corporation • Privacy Policy