-
 A presentation slide deck from Rego University 2021. This course covered Project Tables, OBS, Timeslices, and Methods to find DB objects.
 -
 A presentation slide deck from Rego University 2021. This course covered configuration basics, security basics, installing JS Studio, Interface introduction, data adapter setup, server connection setup.
 -
 A presentation slide deck from Rego University 2021. This course covered:
- Objects, Attributes and Views
- UI Themes and Menu Customization
- Introduction to SQL
- Lookups, Queries and Portlets
- Introduction to Workflow (Processes)
- XOG (XML Open Gateway)
-
 A presentation slide deck from Rego University 2021. This course covered enabling the Modern UX and timesheets, creating a link to the MUX in the classic home menu, creating Blueprints and more.
 -
 Are your reports and portlets performing well? This class will walk through specific SQL tuning tricks to make queries run faster, increase end-user satisfaction, and smooth-out system performance. This is an easy way to promote efficient future development and make a huge, positive impact on user experience.
 -
 Have you experimented with the modern UX channels, links and new page functionality? Our technical experts have unlocked these capabilities to allow you to be creative in what you can do within the modern UX. Come and learn how in this session.
 -
 A review of how Northern Trust integrates financial systems with Clarity PPM bilaterally, providing the Finance organization crucial information, and NT Project Managers with a birds-eye view of project financials. Utilizing the Rego Data Extractor and the Rego Data Processor, these information exchanges help Portfolio and Project Managers eliminate their manual and redundant efforts, solidify their overall data accuracy, and dramatically improve the content provided to their Execs for decision-making.
 -
 MITRE will discuss the recent revival of Clarity enabled by an upgrade and elimination of on-premise non-compliant customizations and their success story. The project leader will address the steps to execute this transformation and the approach taken towards organizational change management.
 -
 Did you stray from OOTB? Was that the right decision? This will be a discussion on pros and cons of sticking to Clarity’s stock attributes, views, and general capabilities. When does it make sense to avoid custom configuration? Conversely, when does it make sense to move beyond the standard OOTB setup?
 -
 By its very nature, the shift to Product Funding is going to require that tracking of that funding. Agile tools do not have much, if any, financial capabilities, so it is important to create an eco-system that can support this value stream—from funding, through delivery, and finally to tracking the realization of financial value. Learn how Rally and Clarity PPM do this very well together.
 -
 Do you want to understand the OOTB configuration and functionality of roadmap management? In this class, we will review the OOTB objects, views, and functions of roadmap management.
 -
 Does your organization struggle with resource management? Have you considered creating a Resource Management Office (RMO)? This session will review how some organizations are using RMOs to drive adoption and effectively manage resources, including real world examples of RMO setup and execution.
 -
 Do you want to understand the OOTB configuration and functionality of resource management? In this class, we will review the OOTB objects, views, and functions of assignments, allocations, and other related areas. We will cover both classic and new UX highlighting differences.
 -
 Are you starting a project/financial management implementation, or do you want to compare how you are using these functions vs. others or best practices? In this class we will discuss some best practices from successful customers.
 -
 Do you want to understand the OOTB configuration and functionality of project management? In this class, we will review the OOTB objects, views, and functions of projects, financial plans, tasks/assignments, IRC, and other related areas. We will cover both classic and new UX highlighting differences.
 -
 Are you starting a demand/portfolio management implementation, or do you want to compare how you are using these functions vs. others or best practices? In this class we will discuss some best practices from successful customers.
 -
 Broadcom’s Laureen Knudsen and Noël Rodriguez discuss the current and evolving state of the PMO.
 -
 Lean Portfolio Management (LPM) is one of the most researched and in demand topics for modern enterprises. Come learn what LPM is, key LPM practices and roles needed for success, and how Clarity and Rally provide end to end visibility from strategy to execution.
 -
 Are you struggling to get data compliance within your instance of Clarity? This class will talk about common compliance problems and discuss potential solutions to help your increase compliance within your organization.
 -
 Has your organization made significant investments in technology solutions without seeing precise results? Do you have the right capabilities yet lack an interconnected, end-to-end solution? A holistic Ecosystem Assessment will evaluate the current state of your project management practices across People, Process, Tools and Governance to compare against industry best practice. Join Rego Expert Guides, Jacob Cancelliere and Nipun Karla, as they discuss our proven process that can help optimize your ecosystem and drive strategic results.
 -
 Are you looking for some great examples of dashboards that include metrics/KPIs? This session will review a host of sample metric dashboards in use today that can spark ideas for you to implement in your company.
 -
 What integrations are the most requested and the most utilized? This class will review the most common interfaces to and from Clarity, including best practice use cases and lessons learned from real implementations.
 -
 Does your organization own Apptio or looking to purchase it? In this session we will dive into what Apptio is and how it complements your current Clarity solution.
 -
 Agile is here to stay, but waterfall may be as well. Companies around the world struggle with living in a bimodal development world, while trying to go through an agile transformation. This session will discuss best practices and lessons learned within companies that have gone through agile transformations. We will also review SAFe as a potential approach.
 -
 What should I expect to see within my organization related to PM over the next couple of years? How should I prepare my PMs, PMOs, or myself to embrace the new trends within the industry? This class will share Rego's observations on industry trends within PPM.
 -
 Have you looked in the regoXchange or reviewed Rego’s innovation offerings? This class will show you the power of Rego’s pre-built content library, integrations, and other assets. See example after example of portlets, processes, and materials you can use to add value to your instance of Clarity. Learn how you can introduce email-based approvals with Rego's action item responder. Get a peek at Rego's new MSP integration that avoids the issues faced with the OOTB integration. Finally, understand Rego's pre-built connectors and how they can benefit your instance. Including blueprint migrator. Include free tools like GEL builder, query, XOGbridge.
 -
 No matter how hard we try, many organizations cannot pry Excel out of the hands of project and resource managers. In this class we will explore possibilities that give up the battle and embrace Excel as a great data entry tool. We will show some neat case studies on quick Excel integrations deployed at customers.
 -
 “Real” Resource management is not for the faint of heart. To get a solid picture of the actual capacity multiple dimensions have to be considered: projects, daily business, absences, different work hours and more. In this session we will demonstrate how this can be done with the help of “Advanced Resource Planning” in Clarity. We will staff projects in seconds, simulate different options, jog new projects in and finally simulate the resource aspect of whole Roadmaps.
 -
 You are no longer regulated to the desktop browser to respond to action items. Learn how Rego solved this problem using just your email. We’ll talk about various use cases where you would get maximum benefit from a simple response on an action item directly from your email. It doesn’t matter if you are using email on your desktop, laptop, phone or tablet. The Action Item Responder as you covered.
 -
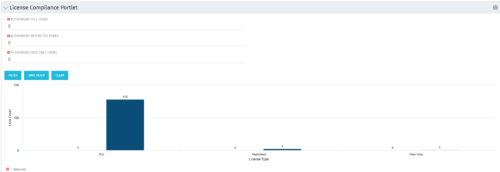 Portlet to quickly show License Compliance for all license types. Simply Enter your License Limits in the filter – The portlet will display the three license types in a grid format with compliance chart and RYG Icons.
 -
Portlet to quickly show License Compliance for all license types. Simply Enter your License Limits in the filter – The portlet will display the three license types in a grid format with compliance chart and RYG Icons.
-
Portlet to quickly show License Compliance for all license types. Simply Enter your License Limits in the filter – The portlet will display the three license types in a grid format with compliance chart and RYG Icons.
-
 Pie Chart Portlet displays counts of active projects with various Stale ratings. Calculation is Percent Stale Tasks = number of open (not completed) tasks with a finish date over 15 days old, divided by total open tasks. Filterable by OBS structure and project manager. Data label = project count. Mouse-over and Legend labels = stale rating. More than 90% Stale means 90 to 100% of open tasks on a project have finish dates older than 15 days. More than 71% Stale means 71 to 89% of open tasks on a project have finish dates older than 15 days. 0 - 70% Stale means fewer than 70% of open tasks on a project have finish dates older than 15 days.
 -
Pie Chart Portlet displays counts of active projects with various Stale ratings. Calculation is Percent Stale Tasks = number of open (not completed) tasks with a finish date over 15 days old, divided by total open tasks. Filterable by OBS structure and project manager. Data label = project count. Mouse-over and Legend labels = stale rating. More than 90% Stale means 90 to 100% of open tasks on a project have finish dates older than 15 days. More than 71% Stale means 71 to 89% of open tasks on a project have finish dates older than 15 days. 0 - 70% Stale means fewer than 70% of open tasks on a project have finish dates older than 15 days.
-
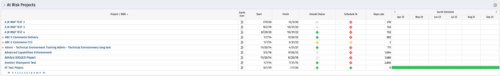 Part of the Business Transformation collection, this bar-chart portlet displays investments and (if exists) any child investments, which are at risk with regard to the schedule of the investments.


Copyright 2023 • Rego Consulting Corporation • Privacy Policy