-
 Resource Management - Are You Doing it Right? Companies of all shapes and sizes need to know if they have the right people working on the right things at the right time, to meet their objectives. Rego's own Grant Zemont has put together this report to help your company learn the best practices for setting up a resource management office correctly. Download the free report here. This White Paper is downloaded from the Rego Consulting site. You will be asked to provide your email address and current ppm tool. - http://info.regoconsulting.com/rmo-report ** Do not Add to Cart - No Downloadable File**
 -
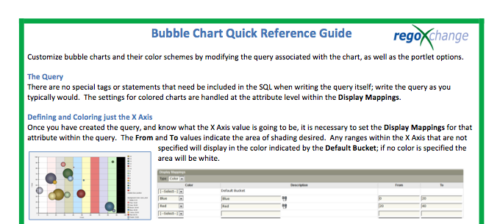 The Bubble Chart Quick Reference Guide provides the user instructions to customize bubble charts and their color schemes by modifying the query associated with the chart, as well as the portlet options. This is very beneficial as it allows the user to match or blend colors among all of the bubble portlets to better display the information the portlets are delivering. Similar data can be one color while different data can be its own color to better show the overall picture.
 -
 Course description: “How are other companies storing or managing documents? This session will discuss options for using native CA PPM, linking to SharePoint, connecting directly to SharePoint, using Google docs, as well as other options. This session will also discuss options for document approval workflows within CA PPM for both collaborative documents and attachment fields.” Download file is the slide deck used during the presentation.
 -
 Course Description: For clients that have both ServiceNow and Clarity PPM, passing information between the systems becomes vital for the enterprise with ITSM, demand, and PPM toolsets. One of the biggest areas of interaction is around demand management. Come and see Rego's integration solution, which flexibly allows for ServiceNow records (incident, problem, idea, enhancement, and demands) to generate Clarity PPM ideas or projects.
 -
 Do you want to add REST interfaces to your Clarity instance? We’ll walk you through specific custom interface examples in GEL and showcase Rego’s Data Processor REST capabilities you can leverage to reduce the time and cost of implementation.
 -
 A presentation slide deck from Rego University 2021. This course covered Project Tables, OBS, Timeslices, and Methods to find DB objects.
 -
 Have you experimented with the modern UX channels, links and new page functionality? Our technical experts have unlocked these capabilities to allow you to be creative in what you can do within the modern UX. Come and learn how in this session.
 -
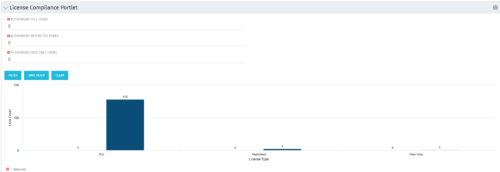 Portlet to quickly show License Compliance for all license types. Simply Enter your License Limits in the filter – The portlet will display the three license types in a grid format with compliance chart and RYG Icons.
 -
Portlet to quickly show License Compliance for all license types. Simply Enter your License Limits in the filter – The portlet will display the three license types in a grid format with compliance chart and RYG Icons.
-
 This training document is a Rego Consulting Quick Reference Guide to assist with the updating, synchronizing and deleting of Roadmap investments in Clarity’s Modern User Experience. This doc references version 16.1 views. Detail is provided on how to update individual Roadmap items within the Grid View, Timeline View and Board View. Included are instructions on how to synchronize Roadmap investments and how to delete an investment from a Roadmap.
 -
 A presentation slide deck from Rego University 2022. The course outline for creation of Power BI Dashboards for Clarity, Beginner Level.
- Overview
- Connecting to Data Sources
- Reports and Dashboards
- Creating a Report
- Data Import Options
- Data Transformation
-
 A presentation slide deck from Rego University 2022. This document reviews best practices for Demand Management.
- Define Demand for your organization
- Support the Planning business process directly in Clarity
- Think through the process to standardize forms and required data – from capturing the data to leveraging it in views, Roadmaps, Hierarchies and/or reports
- Identify and engage Users and Consumers
- Keep it simple: Understand expected business outcomes when defining required fields, and eliminate everything that isn’t necessary
-
 A presentation slide deck from Rego University 2022. The document reviews the best practices around annual planning for your Clarity instance.
- Introduction
- Annual Planning Basics
- Clarity in Annual Planning
- Investment Tracking
- Resource Planning
- Financial Tracking
- Prioritization
-
 A presentation slide deck from Rego University 2022. The document reviews the process to follow post tool implementation.
- Typical Post-Implementation / Operational Challenges
- Aspirations for and Outcomes of a High Performing Ownership Team
- Model Solution:
- Roles and Responsibilities
- Intake, Triage, and Delivery Process
- Clarity Board-Based Solution
-

 The Capacity Graph portlet displays Availability, Allocations, Actuals and Assignments for one or more active resource(s) in a single view. This portlet pulls data from timeslices, and allows the user to filter on a weekly, monthly or quarterly data. The Estimated Time to Complete (ETC) and Allocation data will only show for projects that are active. This portlet provides Resource Managers, PMOs and Executives with a simple way to analyse: Allocations vs. Availability, Allocations vs. Actuals, Allocations vs. ETC and ETC vs. Availability. The graph allows the user to determine where areas of improvement may exist and quickly identify potential areas of constraint. Note: the information displayed is dependent on what the user has security rights to view.
 -
The Capacity Graph portlet displays Availability, Allocations, Actuals and Assignments for one or more active resource(s) in a single view. This portlet pulls data from timeslices, and allows the user to filter on a weekly, monthly or quarterly data. The Estimated Time to Complete (ETC) and Allocation data will only show for projects that are active. This portlet provides Resource Managers, PMOs and Executives with a simple way to analyse: Allocations vs. Availability, Allocations vs. Actuals, Allocations vs. ETC and ETC vs. Availability. The graph allows the user to determine where areas of improvement may exist and quickly identify potential areas of constraint. Note: the information displayed is dependent on what the user has security rights to view.
-
 The Timesheet Detail report provides a detailed view of timesheet entries for each resource within a selected time period. It includes hours logged against tasks, other work, incidents, and indirect activities, displayed by day and in total. The report also captures any notes associated with each time entry, offering visibility into how time is allocated across different work types.
 -
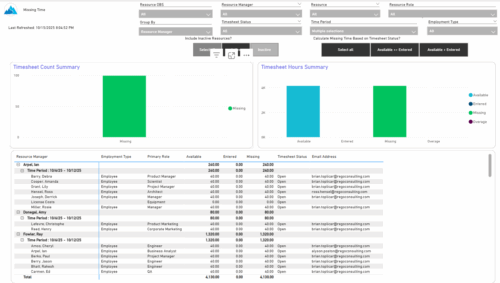 The Missing Time report provides insight into timesheet compliance by comparing available hours, entered hours, and missing hours for each resource over a selected time period. It can be grouped by resource manager or OBS level and offers flexibility to calculate missing time based on timesheet status or resource availability. The report includes summary charts showing timesheet completion rates and total hours, highlighting completed, partial, and missing timesheets as well as overages across reporting periods.
 -
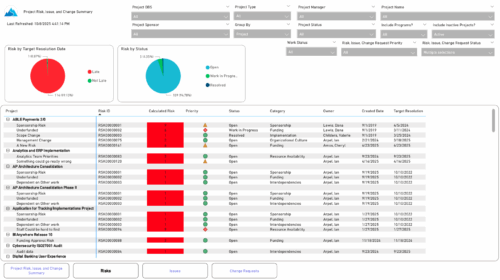 The Project Risk, Issue, and Change Summary report provides an overview of project health by visualizing risks, issues, and change requests. It includes pie charts that display counts by target resolution or expected close date, as well as by status. A detailed table lists each item’s name, ID, priority, status, category, owner, creation date, and resolution or close date. Results can be grouped by project or viewed without grouping to support flexible analysis and tracking.
 -
 Take a deep dive into Clarity's REST APIs. You will learn different ways to explore Clarity's API's using the REST API explorer, Postman, and Chrome's Developer Tools. We will cover HTTP methods, status codes, Clarity-specific headers, and creating and parsing JSON.
 -
 This course will take a deep dive into Modern UX administration. We'll cover the advanced MUX Administration settings, managing system wide views before deep diving into advanced blueprints topics such as visuals, modules, rules, and actions.
 -
 Tired of repeating the same code in your GEL scripts? Prefer not to write thirty lines just to call a REST web service? Learn tips and tricks for reusing code—like using <include> tags and Rego’s Jam Tags solution to simplify and streamline your scripts. In this session, you'll learn the functionality and advantages to using Jam Tags within your GEL scripts to accomplish tasks that were tedious, error prone, and in some cases impossible within GEL.
 -
 Take your Resource Planning to the next level with itDesign’s Advanced Resource Planning add-on for Clarity.
 -
 Annual planning shouldn’t be an Excel nightmare—or disconnected from strategy. In this session, see how one organization used Strategic Portfolio Management (SPM) with Clarity to transform their budgeting process from reactive to strategic.


Copyright 2023 • Rego Consulting Corporation • Privacy Policy