
- Introduction to Power BI and its components
- Getting Data
- Mockup – PM and RM Dashboard
- Publishing and Sharing
- Best practices and its limitations
- Tableau Introduction
-

-
 Course Description: “For clients that have both ServiceNow and CA PPM, passing information between the systems becomes vital for the enterprise with both ITSM and PPM toolsets. One of the biggest areas of interaction is around Demand Management. Come and see Rego's Integration solution which flexibly allows for ServiceNow records (Incident, Problem, Idea, Enhancement, and Demands) to generate CA PPM Ideas or Projects. This lets you control where you want to perform Demand Management, and the work lands in CA PPM's Project either way.” Download is the slide deck used for the presentation.
 -
 Course description: “Do you want to learn how to get basic data out of CA PPM for use in portlets? This class will review the basic CA PPM data model and provide training on how to write queries within CA PPM for use in your portlets and reports.” Download file is the slide deck used during the class.
 -
 Course description: “Are you struggling with deploying Jaspersoft reports between environments? This class will walk through the process and provide some tips and tricks from the experts.” Download file is the slide deck used during the presentation.
 -
 Course description: “How are other companies storing or managing documents? This session will discuss options for using native CA PPM, linking to SharePoint, connecting directly to SharePoint, using Google docs, as well as other options. This session will also discuss options for document approval workflows within CA PPM for both collaborative documents and attachment fields.” Download file is the slide deck used during the presentation.
 -
 Course description: “Do you have users that just want an XLS or CSV file emailed to them with data? This session will be a hands-on lab to create a workflow process that will pull data from CA PPM and email that data in a file to a user or group of users.” Download file is the slide deck used during the presentation.
 -
 Course description: “What can leaders do after a CA PPM deployment to ensure continued success of the product? This session will discuss how sponsors can drive compliance within the organization through continued involvement. Strong sponsorship is the key to long term success.” Download file is the slide deck used during the presentation.
 -
 Course Description: “Does your organization have an external BI tool like Cognos, Tableau, Domo, or Qlikview? This session will review strategies for getting data into your corporate BI tools.” Download file is the slide deck used during the presentation.
 -
 Course description: “How does my financial forecast and budget (project/program/portfolio) relate to the department/cost center budgets that finance prepares? Is there a better way to link the two together? This is a topic many organizations struggle with, and this session will review tools and processes that can help solve this problem.”
 -
 Course description: “It’s easy to focus on the “cool” new features of the latest release and overlook the impact on specific End Users, and how they actually use new features and modules. Focusing on what Users need and want may not be easy, but it will lead to greater engagement, strong adoption and increase value of CA PPM. Join Empowered Networks for this session to discuss how to leverage User Personas in configuring CA PPM.”
 -
 Course description: “Are you an NPD CA PPM user? This session is dedicated to NPD users to discuss some of the unique requirements and configurations needed to support project management for new product development.” Download file is the slide deck used for the presentation.
 -
 Course description: “Are you ready to go beyond simple graph and grid portlets? This class will show you how to create and export portlets with hierarchical structure and drill-down capability, and includes examples of advanced portlets and complex queries.” Download file is the presentation slide deck.
 -
 Course description: “Are you struggling with decision making processes? This session will show you the ins and outs of how a good governance framework provides the foundation for better project decisions to help achieve goals and finish on time and within budget.” Download file is the presentation slide deck.
 -
 Course description: “Did you implement tool functionality without best practice processes? This class will review some of the critical business processes that we recommend organizations put in place before implementing a PPM tool. We will provide tips and tricks on defining process frameworks while leveraging tools for successful enablement.” Download file is the presentation slide deck.
 -
 Course description: “Does your organization struggle with resource management? Have you considered creating a Resource Management Office (RMO)? This session will review how some organizations are using RMOs to drive adoption and effectively manage resources, including real world examples of RMO setup and execution.” Download file is the presentation slide deck.
 -
 Course description: “Is there a way to simplify time tracking? Time is a function 90% of companies use. What are ways to have time be less of a burden to users? How can you minimize the negative perception? This session will discuss options within CA PPM or outside CA PPM to make time tracking less of a burden for all.” Download file is the presentation slide deck.
 -
 Course description: “Are some of your users leveraging a Smartsheet add-on for project planning, or are you looking for an alternative to OWB and MSP? Learn how this new scheduling tool is making waves and adding value for project managers working within CA PPM.” Download file is the presentation slidedeck.
 -
 Course description: “How do you close the feedback loop with your users? This session will review some innovative ways companies are connecting with CA PPM users to drive constant innovation and improve perception of the process and tool.” Download file is the presentation slide deck.
 -
 Course description: “Do CA PPM performance issues discourage your users? This class will review the root causes behind CA PPM performance problems and identify steps to improve performance, including specific recommendations and real case studies.”
 -
 Course description: “Does CA PPM Timeslice functionality seem like a foreign language to you? This intro to timeslices will cover an Overview of Timeslice Fundamentals, Terminology, Best Practices, Diagnostics, and the basic SQL Constructs to get you started.”
 -

 The Multi-Value Filter in Query-Based technical trick document provides an overview of how to create a multi-value lookup in a portlet filter, where the field is a parameter within the query. If the query imbeds the parameter normally, the portlet will only be able to have a single selection of that parameter. This technical solution will enable you to make these parameters multi-selects.
 -
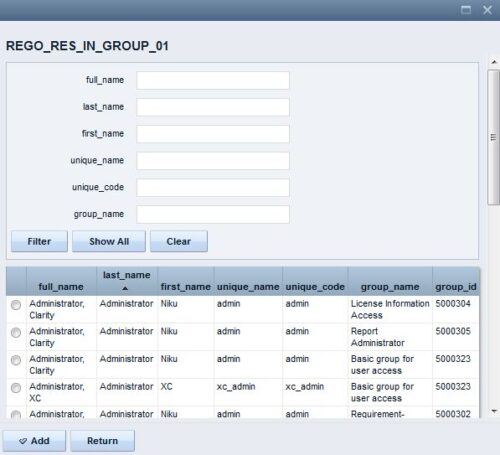 The Resource Lookups in a Group technical trick provides step-by-step instructions on creating a resource lookup based on members of a particular security group. For some fields, you want to narrow the amount of resources that the resource browse window supplies. By adding the selected users to a specific security group, the administrator may only display those resources in a resource browse window on the application side.
 -
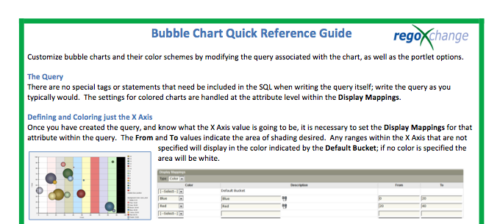 The Bubble Chart Quick Reference Guide provides the user instructions to customize bubble charts and their color schemes by modifying the query associated with the chart, as well as the portlet options. This is very beneficial as it allows the user to match or blend colors among all of the bubble portlets to better display the information the portlets are delivering. Similar data can be one color while different data can be its own color to better show the overall picture.
 -
The Bubble Chart Quick Reference Guide provides the user instructions to customize bubble charts and their color schemes by modifying the query associated with the chart, as well as the portlet options. This is very beneficial as it allows the user to match or blend colors among all of the bubble portlets to better display the information the portlets are delivering. Similar data can be one color while different data can be its own color to better show the overall picture.
-

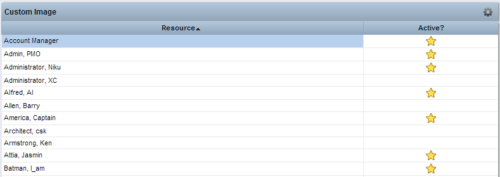 This Tech Trick provides step-by-step instructions for adding images into Clarity v13+ for use in portlets.
 -
 Many times Roles are spread out geographically or by function and these Roles will have different rates. For example, a developer in India may charge $25/hour vs a Developer in US may charge $50/hour. When the project team has a requirement of several developers, the PM will have to add a region specific role (Developer-US, Developer-India) so that the right rates can be applied when a cost plan is created. This creates a challenge in terms of Resource Management. As the Demand and Capacity can be spread between different region specific roles. Proper configuration on the Rate Matrix can allow you to have one Role name but different rates based on Location or Department. This allows greater flexibility and takes away the redundancy of Role Names. You can do so with the Project Team Member Properties.
 -
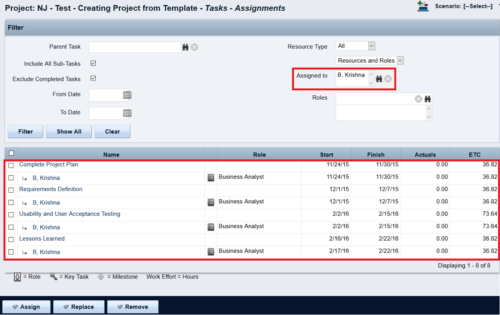
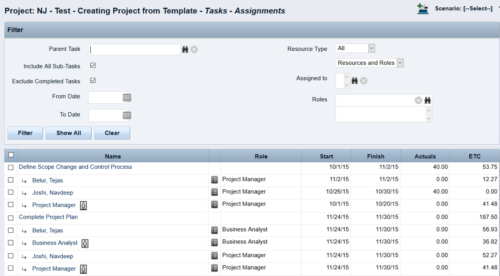 This Tech Trick walks you through the steps in CA PPM to make Bulk Role replacements on tasks. Useful when you want to make the changes to the project template which has a large WBS structure, and a lot of role assignments to tasks.
 -
 So, you have the portlet xogged in, what now? This guide will show you how to create a page, add the portlet to the page, and add the page to the menu. This activity requires the appropriated admin rights to add content to CA PPM.
 -
 Fiscal periods in DWH may need to be changed if we need to increase or decrease the number of periods for reporting.
 -
 This tech trick document reviews the different reporting options you have in CA PPM and the benefits of each options. Jaspersoft, PowerBI and Tableau are all discussed.
 -
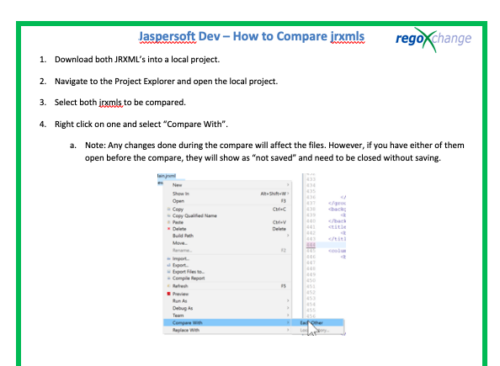 This document’s purpose is to help the reader compare jrxmls for Jaspersoft.
 -
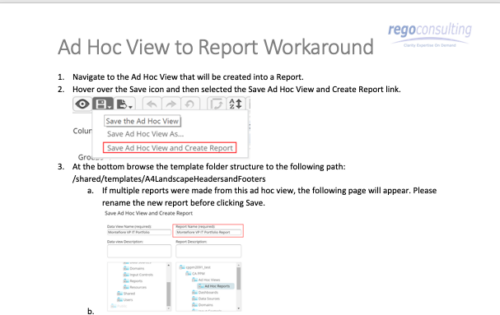 This tech-trick details the steps to convert an ad-hoc view to a report.
 -
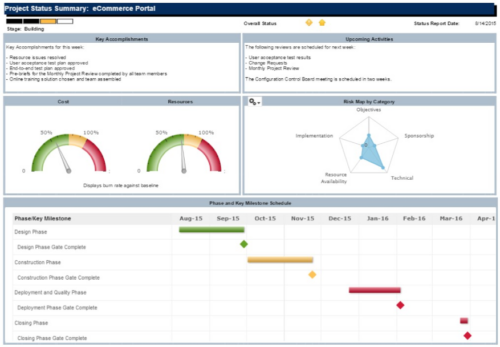 The Project Status Summary report is a transaction based Jaspersoft report that does not require the Load Jaspersoft Datawarehouse job to be run. The report will pull real-time data from the transaction tables in Clarity. This report can be run from either the Advanced Reporting or Reports and Jobs area within Clarity. The Project Status Summary report displays summary information about a project, including current stage, overall status, key accomplishments, upcoming activities, the cost and amount of resources that are consumed, mapped risks indicating categories with a high number of risks, and a high-level Gantt chart displaying information about the project phases and key milestones.
 -
 This video covers the process of accessing timesheets within Clarity, both as a team member and as a Project or Resource Manager.
 -
 This video covers the process of adding tasks to the timesheet using Populate and Add Task, using the timesheet notes functionality, entering timesheet data, updating ETC via the timesheet, and submitting the timesheet.
 -
 This video reviews how to return and approve Clarity timesheets as a Project or Resource Manager.
