-
 The hit TV series Ted Lasso is well known for its humor and entertainment value, but hidden under the light-hearted banter are some important messages that leaders can take to heart. Join expert Agile guide, Tad Beaty, for a review of the first two seasons of the show. We’ll explore the messages that all leaders should take back to the office to improve engagement and make a better workplace.
 -
 Hear what the journey from Project to Product looks like from the trenches. IHG will share tales of what it took to make this transition, some challenges they faced, and what outcomes they have been able to achieve.
 -
 Agile metrics can be very different from traditional waterfall metrics. This session will walk through some of the key Agile metrics describing how and why they are used. Effective methods in reporting and sharing will also be covered.
 -
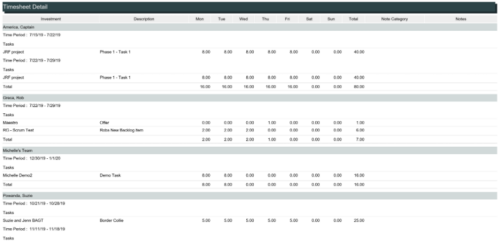 The Timesheet Detail report is a transaction based Jaspersoft report that does not require the Load Jaspersoft Datawarehouse job to be run. The report will pull real-time data from the transaction tables in Clarity. This report can be run from either the Advanced Reporting or Reports and Jobs area within Clarity. The Timesheet Detail report displays timesheet entries for a resource and time period. The timesheet entries include tasks, other time, incidents, and indirect time. The report shows the timesheet hours by day and in total, with any notes related to the time entry.
 -
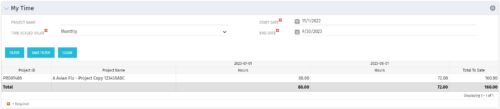 The My Time portlet provides the logged in user with the ability to view his or her time by project by time period without having to go into each period individually on the Timesheets page. This portlet uses the actual timeslices to retrieve data. It displays the amount of time worked per week, month or quarter on projects. The user may specify the dates, time-scaled value and the project name. The portlet also provides a Total to Date, which shows the total number of actuals for that resource on that assignment.
 -
 This training document is a Rego Consulting Quick Reference Guide to assist with the use of the Staffing Plan in Clarity’s Modern User Experience. This doc references version 16.0.3 views. Document provides information on how to swap between views to see investments by resource or resources by investment. Instructions on filtering are provided, as well as detail on how to update the unit of measure between FTE (Full Time Equivalent) and Hours. Tips are provided on how to expand the list of investments within each view and how to view the properties for the allocations. A Legend is also documented to provide information on each of the icons that are displayed on this page.
 -
 This training document is a Rego Consulting Quick Reference Guide to assist with the creation of Status Reports in Clarity’s Modern User Experience. This doc references version 16.0.3 views. Document covers the creation of Status Reports via the Status Module as well as the Status Report Module. Detail is provided on the widgets that can be used within the Status Report canvas as well as instructions on how to configure the canvas. Detail is also provided on how to Preview and Publish status reports.
 -
 This training document is a Rego Consulting Quick Reference Guide to assist with placeholder role replacement in Clarity’s Modern User Experience. The document reviews accessing and fulfilling requests.
 -
 This training document is a Rego Consulting Quick Reference Guide to assist with setting up financial plans for ideas in Clarity’s Modern User Experience. The document reviews Ideas Cost Plans and Idea Budget Plans.
 -
 A Quick Reference Guide to assist in the creation of Financial Plans for Ideas in Clarity’s Modern UX. In Modern UX you can only create Manual Financial Plans. Go to Classic if you want to create a Cost Plan from Investment Team a Budget Plan or Benefit Plan.
 -
 A Quick Reference Guide that covers how to staff a Team in Clarity’s Modern UX. It reviewes some of the key terminology, covers Allocation vs. ETC, accessing the Staffing Tab, and viewing time-scaled allocations.
 -
 CA has advertised the addition of RESTful APIs into the core product in version 14.3. What does this mean to you? What does this do to help you support CA PPM? This class will review the new APIs and discuss what they enable for you.
 -
 A .pdf file that has the slide by slide presentation at 2015 RegoU on how other companies are using CA PPM. The agenda covers an overview, definitions, business value, key requirements and best practices.
 -
 ** No Download - Do not Add to Cart ** KPIs and metrics have been around forever. With the prevalence of Agile integrations and an increased focus on business value, it is time for a reimagining of progress and success measurements in Clarity. In this webinar, Rego expert guides Alyson Poston and Wes McCoubrie will discuss the following: - Metrics you should monitor beyond the traditional Scope, Schedule, Cost and Effort. - Key Agile data you should incorporate into your metrics. - Today’s critical business metrics and key results (OKRs) to track. - What comes out-of-the-box with Clarity, and of those, which ones does Rego recommend you introduce into your organization. ** No Download ** follow this link to sign up to view the recorded webinar - http://info.regoconsulting.com/clarity-kpis-and-metrics-march-2021
 -
 Effective resource management is vital for delivering successful and profitable projects. Get it right and costs will be controlled, objectives achieved, and deadlines met. Get it wrong and we run the risk of not just project timescales slipping but also margins and competitive advantages eroding. This paper looks at resource management best practices and how we can adopt practices to increase project quality, agility, and efficiency. This White Paper is downloaded from the Rego Consulting site. You will be asked to provide your email address and current ppm tool. - http://info.regoconsulting.com/smarter-resource-mgmt-whitepaper ** No Download - Do not Add to Cart **
 -
 Rego’s training materials for Managing Portfolios in Clarity. The slide deck was put together using Clarity version 15.4.1. This course will describe how to:
- Organize Portfolios
- Define Portfolio Properties
- Build Portfolio Contents and Synchronization
- Define Portfolio Targets
- Utilize the Portfolio Waterline
- Ranking Investments
- Scenario Planning
- Portfolio Analysis and Outputs
-
 Rego’s training materials on Clarity PPM Financials. This slide deck in based on the classic version of Clarity v15.4.1. Course materials start with an introduction, move to Cost Plans, Budget Plans and then finish with Reporting of Financial Data. There is also an appendix of supporting information.
 -
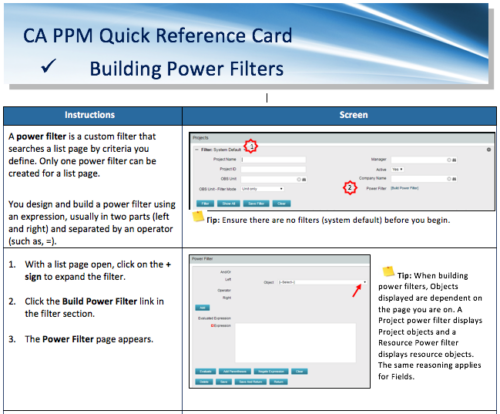 A Quick Reference Card to assist in the building of Power Filters in CA PPM. A power filter is a custom filter that searches a list page by criteria you define. Only one power filter can be created for a list page.
 -
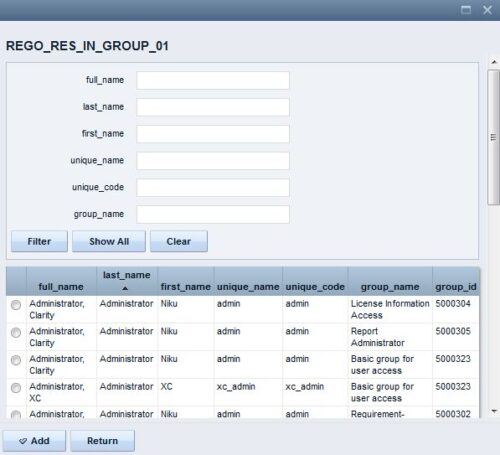 The Resource Lookups in a Group technical trick provides step-by-step instructions on creating a resource lookup based on members of a particular security group. For some fields, you want to narrow the amount of resources that the resource browse window supplies. By adding the selected users to a specific security group, the administrator may only display those resources in a resource browse window on the application side.
 -

 The Multi-Value Filter in Query-Based technical trick document provides an overview of how to create a multi-value lookup in a portlet filter, where the field is a parameter within the query. If the query imbeds the parameter normally, the portlet will only be able to have a single selection of that parameter. This technical solution will enable you to make these parameters multi-selects.
 -
 Course description: “Are you struggling with deploying Jaspersoft reports between environments? This class will walk through the process and provide some tips and tricks from the experts.” Download file is the slide deck used during the presentation.
 -

- Introduction to Power BI and its components
- Getting Data
- Mockup – PM and RM Dashboard
- Publishing and Sharing
- Best practices and its limitations
- Tableau Introduction
-
 Are you starting a resource management implementation, or do you want to compare how you are using these functions vs. others or best practices? In this class we will discuss some best practices from successful customers.
 -
 Do you want to understand the OOTB configuration and functionality of financial management? In this class, we will review the OOTB objects, views, views, and functions of financial plans, rates, and other related areas. We will cover both classic and new UX highlighting differences.
 -
 Do you want to understand the OOTB configuration and functionality of project management? In this class, we will review the OOTB objects, views, and functions of projects, financial plans, tasks/assignments, IRC, and other related areas. We will cover both classic and new UX highlighting differences.
 -
 Have you looked in the regoXchange or reviewed Rego’s innovation offerings? This class will show you the power of Rego’s pre-built content library, integrations, and other assets. See example after example of portlets, processes, and materials you can use to add value to your instance of Clarity. Learn how you can introduce email-based approvals with Rego's action item responder. Get a peek at Rego's new MSP integration that avoids the issues faced with the OOTB integration. Finally, understand Rego's pre-built connectors and how they can benefit your instance. Including blueprint migrator. Include free tools like GEL builder, query, XOGbridge.
 -
 “Resources with No Basic Matrix Entry” portlet displays combinations of project and resource where the assigned resource does or does not have a rate established for that project. Portlet is filterable by Projects, Project ID, Resources, and Missing Rate (Yes, No, All). How does this work? The Rate Matrix Extraction job populates a record into the NBI_PROJ_RES_RATES_AND_COSTS table for every resource/project combination that meets any of the rate matrix criteria. This portlet checks that table, and sets the Missing Rate attribu
 -
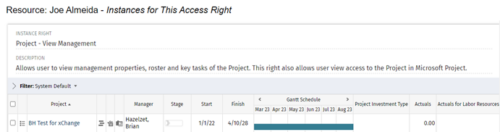
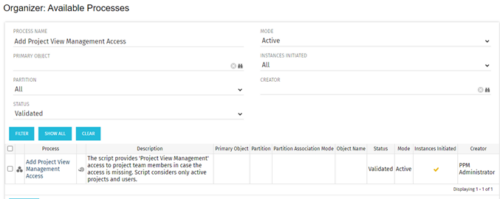 This process grants Project Management instance rights to all of the project team members within the program hierarchy. Allows users to view management properties, roster and key tasks of the project. This also allows user view access to the project in Microsoft Project.
 -
 A presentation slide deck from Rego University 2022. Broadcom’s presentation on OKRs in an Agile environment.
- What are OKRs? Why are they important?
- Why ValueOps for OKRs?
- How do we do this?
-
 A presentation slide deck from Rego University 2022. This document is an outline used for the class on using GEL Scripts in Clarity development.
- XML Manipulation
- SOAP Web Services (XOG)
- Code Reuse
- Best Practices
-
 A presentation slide deck from Rego University 2022. This document is the course material for the Clarity Beginner Admin class.
- Clarity Overview
- Resources and Users
- Objects and Attributes
- Security Setup
- Organizational Breakdown Structures (OBS)
- Intro to Lookups
- Financials Basics
- Scheduling Jobs
-
 A presentation slide deck from Rego University 2022. This document reviews the issues around tool adoption and strategies to overcome them.
- The Perception of Adoption
- Top 5 Signs That You May Have Low Adoption
- What is Adoption
- Survey – What is Your State of Adoption
- Keys to Success – What We Have Seen
-
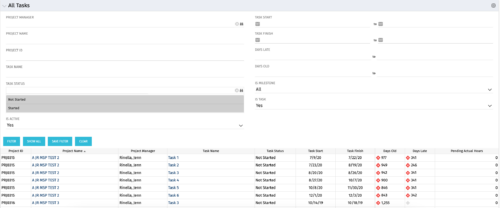 The All Tasks portlet displays all tasks related to active projects that the logged in user has view rights to. The portlet provides the project manager a single place to view tasks across multiple projects without having to go into each project individually, and allows for more efficient management and reporting across projects. The portlet displays project actuals and estimates from the project (datamart tables). The portlet allows analysis like:
- PMs may have several critical tasks that were supposed to start on a certain date. To verify progress, they filter for that start date to perform a review of the tasks.
- PMs can review days late to see how tasks are doing against the baseline date (<7 days is green, 7-14 is yellow, and >14 is red)
- PMs can review days old to see how tasks are doing against today’s date (<7 days is green, 7-14 is yellow, and >14 is red)
Column Label Description Project ID Unique project identifier Project Name Name of the project Project Manager Manager of the project Task Name Name of the task Task Status Not Started, Started, or Completed Task Start Start Date of this task Task Finish Finish Date of this task -
 The All Risks portlet displays all risks related to active projects that the logged in user has view rights to access. The portlet provides the project manager a single place to view risks across multiple projects without having to go into each project individually, and allows for more efficient management and reporting across projects. The portlet displays Project ID, Project, Risk ID, Risk, Category, Assigned to, Status, Probability, Impact, Priority, Target Resolution Date, and Days opened. The filter allows narrowing down of the risks by several different criteria. Note: Only the projects that the user has viewer rights to see will show up in the list.
 -
 The Resource Time Summary and Detail report provides insight into timesheet hours and notes for each resource across selected time periods. Data can be grouped by resource manager, time period, or any OBS level to support flexible analysis. Interactive visuals allow easy tracking, monitoring, and review of resource time allocation.
 -
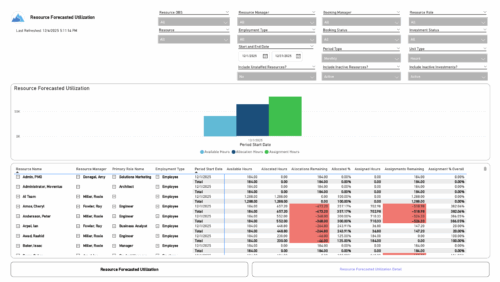 The Resource Forecasted Utilization report provides a high-level view of resource workload by displaying availability, allocation, and assignment amounts over time. Data can be viewed weekly, monthly, or in total, helping teams understand capacity and forecasted demand. Values are shown in either hours or full-time equivalents (FTEs), making it easy to compare utilization across resources and time periods.


Copyright 2023 • Rego Consulting Corporation • Privacy Policy