-
 Course description: “What can leaders do after a CA PPM deployment to ensure continued success of the product? This session will discuss how sponsors can drive compliance within the organization through continued involvement. Strong sponsorship is the key to long term success.” Download file is the slide deck used during the presentation.
 -
 Course Description: “Does your organization have an external BI tool like Cognos, Tableau, Domo, or Qlikview? This session will review strategies for getting data into your corporate BI tools.” Download file is the slide deck used during the presentation.
 -
 This training document is a Rego Consulting Quick Reference Guide to assist with the process of creating financial actuals and the supporting reports in Clarity’s Modern User Experience. The document covers running jobs to sync data, analyzing cost plans, reviewing transactions, and analyzing cost and budget plans.
 -
 This session offers practical solutions to financial challenges faced in enterprise agile environments. Participants will learn best practices for budgeting, forecasting, capitalization, and labor cost allocation, as well as both short-term tactical advice and longer-term strategic insights. The session covers topics such as participatory budgeting, flipping the iron triangle, and funding teams, products, and capabilities instead of projects.
 -
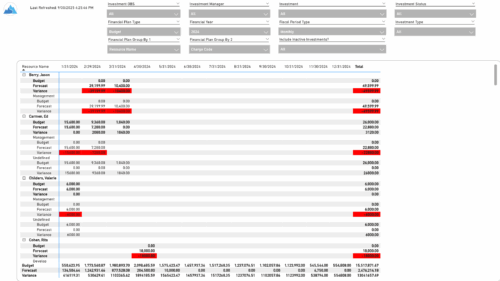 The Financial Budget vs. Forecast by Period report provides insight into financial performance by comparing planned or budgeted costs against forecasted costs across defined time periods. It highlights period-level and total variances to help identify trends and deviations. Results can be grouped by up to two financial attributes, such as Charge Code, Cost Type, Department, Input Type, Location, Resource, Resource Class, Role, Transaction Class, or User Values 1 and 2, allowing flexible analysis by key dimensions.
 -
 The Financial Budget vs. Forecast by Period Detail report provides a detailed breakdown of planned or budgeted costs compared to forecasted costs by investment. It displays variances for each period and in total. Users can filter or drill down to view the specific investments that contribute to selected financial plan groupings.
 -
 Do you want to understand the OOTB configuration and functionality of financial management? In this class, we will review the OOTB objects, views, views, and functions of financial plans, rates, and other related areas. We will cover both classic and new UX highlighting differences.
 -
 Course Description: Do you want to talk to other customers that are using or plan to use financial management? In this moderated round table, customers can share experiences and provide insights on process, configurations, challenges, and successes. We will divide into small groups and discuss customer selected topics—100% sharing.
 -
 Do you want to talk to other customers that are using or plan to use financial management? In this moderated Round Table where customers can share experiences and provide insights on process, configurations, challenges, and successes. We will have an expert panel and then divide into small groups and discuss customer selected topics - 100% sharing.
 -
 Do you want to talk to other customers that are using - or plan to use - Clarity's financial management capabilities? In this moderated Round Table, attendees can share experiences and provide insights on process, configurations, challenges, and successes. We will have an expert panel and then divide into small groups to discuss customer selected topics. 100% sharing, 100% learning.
 -
 This course will focus on the financial setup and processing in Clarity. We'll discuss topics such as financial entities, fiscal periods, financial attributes, and how they all tie back to a labor rate matrix. These components are crucial for calculating labor costs within Clarity and enabling project managers to make financially sound decisions.
 -
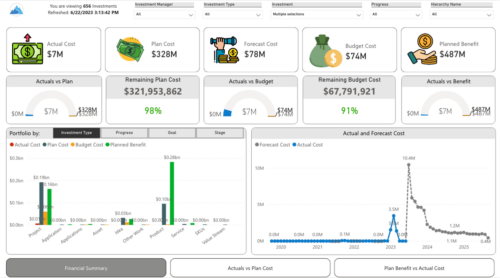
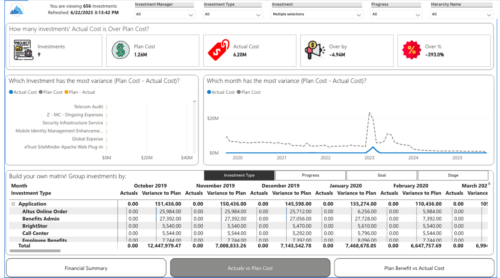
 Gain a financial view of your investments by comparing actuals to planned cost and planned benefit. Report views include: • Financial Summary • Planned Benefit vs Actual Cost • Actuals vs Planned Costs Demo Video - https://www.youtube.com/watch?v=uyDSbbgG1O8&list=PLXJ5ktuWV0jiS9CvBpHvBIwpKPmA9uvwK&index=2
 -
 Gain a financial view of your investments by comparing actuals to planned cost and planned benefit. Report views include:
- Financial Summary
- Planned Benefit vs Actual Cost
- Actuals vs Planned Costs
-
 A slide deck used in Rego’s training sessions around Financials, in Clarity’s modern UX. The slides cover the Value of Financial Management, Core Financial Components, Investment Financial Attributes, the Rate Matrix, Cost/Budget/Benefit Plans, Actual Costs, Integrations, and Best Practices.
 -
 Digital transformation is hard, only 15% of businesses succeed. This course looks at the five biggest customer issues hurting the digital transformation, with a discussion around possible solutions.
 -
 Aligning work to organizational strategy is a fundamental requirement in today's ever-changing marketplace. High performing organizations are moving beyond basic connections to introduce strategic hierarchies that are tied to real measurements of business value via Clarity's Objectives and Key Results (OKRs). Join our expert guides as they present key concepts, best practices, and the evolution of strategic alignment.
 -
 So, you have the portlet xogged in, what now? This guide will show you how to create a page, add the portlet to the page, and add the page to the menu. This activity requires the appropriated admin rights to add content to CA PPM.
 -
 Funnel Chart displays aggregated counts of Ideas by “Idea Progress”, a custom attribute. Chart shows Idea Progress names in legend, and count total is available as a mouse-over. No filters available on this portlet.
 -
Funnel Chart displays aggregated counts of Ideas by “Idea Progress”, a custom attribute. Chart shows Idea Progress names in legend, and count total is available as a mouse-over. No filters available on this portlet.
-
Funnel Chart displays aggregated counts of Ideas by “Idea Progress”, a custom attribute. Chart shows Idea Progress names in legend, and count total is available as a mouse-over. No filters available on this portlet.
-
 A presentation slide deck from Rego University 2022. Document used in Broadcom’s presentation on Value Steam Metrics.
- Steering the Business with Metrics
- Executive Strategy
- Metrics Approach
-
 Are you ready to take your GEL scripting skills to the next level? This class will teach you how to leverage Java within GEL, manipulate or produce flat files, and handle errors effectively.
 -
 A presentation slide deck from Rego University 2022. This document is an outline used for the class on using GEL Scripts in Clarity development.
- XML Manipulation
- SOAP Web Services (XOG)
- Code Reuse
- Best Practices
-
 Do you have a basic understanding of GEL scripts but need to a better understanding of how they work? This class will teach you how to XOG data in and out of objects in GEL as well as perform basic emails inside GEL.
 -
 A presentation slide deck from Rego University 2022. This document is an outline used in class for use of GEL Scripts in Clarity Development.
- Introduction
- Configuration Basics
- Security Basics
- Installing Jaspersoft Studio
- Interface Introduction
- Data Adapter Setup
- Server Connection Setup
-
 Have you never used GEL within Clarity? This class will teach you the basics of leveraging GEL within your workflow process. It’s one of the most powerful and underutilized capabilities in Clarity for updating objects, sending emails, and XOGing. This class is designed for those that have never used GEL before.
 -
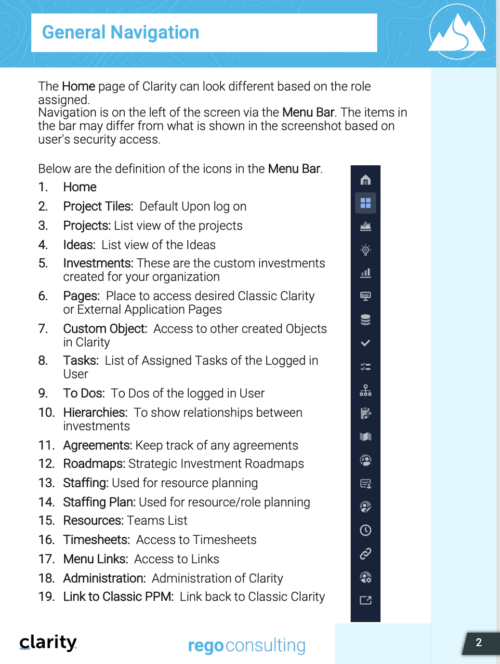
 This training document is a Rego Consulting Quick Reference Guide to assist with General Navigation in Clarity’s Modern User Experience. This doc references version 16.0 views. Doc reviews the Menu Bar and User Tool Bar.
 -
 A Quick Reference Guide to assist with General Navigation of Clarty, using the Classic UX with the Phoenix UI Theme. Reviews the Main Menu Bar, User Tool Bar, Home Menu, Favorites Menu, and more.
 -
 ** No Download - Do not Add to Cart** - Register for the White Paper at this link - http://info.regoconsulting.com/clarity-innovations-from-rego-march-2020 With enterprise-level interconnectivity on the rise, many organizations find that their Clarity toolset isn’t as tightly integrated as it could be. Disparate platforms, annoying redundancies, and personal tool preferences may result in significant losses in time, productivity, and money. In this white paper, we’ll briefly discuss six Rego innovations and connectors designed to help organizations get more out of their Clarity investment. - http://info.regoconsulting.com/clarity-innovations-from-rego-march-2020 With enterprise-level interconnectivity on the rise, many organizations find that their Clarity toolset isn’t as tightly integrated as it could be. Disparate platforms, annoying redundancies, and personal tool preferences may result in significant losses in time, productivity, and money. In this white paper, we’ll briefly discuss six Rego innovations and connectors designed to help organizations get more out of their Clarity investment.
 -
 Course Description: Are your project teams using SharePoint effectively and getting the most value out of it? Is document management a daily struggle? Learn how to use SharePoint with Clarity PPM to seamlessly improve collaboration and team productivity.
 -
 This quick discussion will highlight tips for ensuring you will get the most out of your Rego University experience. We will discuss how to select classes, meet with peers, and obtain one on one advice over the 3 days of the conference.
 -
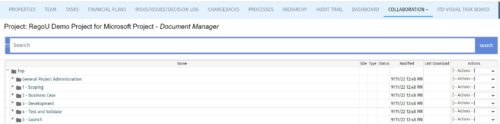 The Give PM Collaboration Manager Rights workflow process can be run through the "Execute a Process" job. The workflow will execute a query that gives a Project Manager the Collaboration Manager rights to their projects. Often times, PMs are not set as Collaboration Managers when the project is created. This script can be run to automatically give a PM the Collaboration Manager rights to their projects, without having to go through the projects one by one.
 -
The Give PM Collaboration Manager Rights workflow process can be run through the "Execute a Process" job. The workflow will execute a query that gives a Project Manager the Collaboration Manager rights to their projects. Often times, PMs are not set as Collaboration Managers when the project is created. This script can be run to automatically give a PM the Collaboration Manager rights to their projects, without having to go through the projects one by one.
-
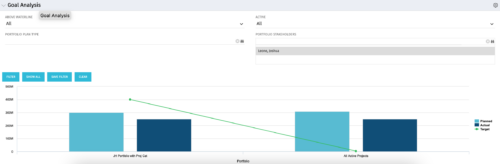 Part of our Business Transformation collection, this portlet relates exclusively to Benefit costs in the Portfolio and its investments. Portlet is a combination of Line Chart and Vertical Bar Charts. It displays data for one or more portfolios depending on rights and filters. Green Line represents Portfolio Target Benefits. Light blue bar represents aggregation of investment Planned Benefits. Dark blue bar represents aggregation of Investment Realized Benefits (actual benefits). Filtering is available for Above or Below Waterline investments OR all portfolio Investments. May also filter on Portfolio values as well as Plan values. Filtering also available for Active vs Inactive Portfolios.


Copyright 2023 • Rego Consulting Corporation • Privacy Policy