-
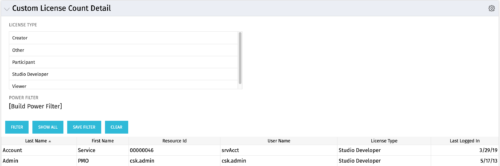 The Custom License Count Detail portlet displays the license type information for all users within Clarity as well as last login date for clean-up. This portlet can be modified by adjusting the query to exclude certain rights within manager licenses based on negotiated license types with CA. For example, if CA allows creation of a sub-object to Incident to be included in a Team Member license, this portlet can be used to reflect the true license counts vs. the standard CA license counts.
 -
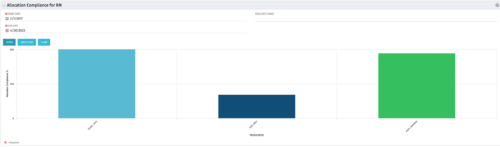 The Allocation Compliance by Resource (Resource Manager) portlet gives a view of resource allocation compliance for all active resources the logged in user is the Resource Manager for. It allows the RM to see resources they manage over the coming months and whether they are over or under allocated. This portlet leverages the daily allocation and daily availability slices as well as only active investments. The portlet provides filters for specific dates, filtering by resource ID, and resource name may also be added.
 -

 This Portlet can be used to define User License Output information including the following:
- Resource
- Resource User Name
- Resource Id
- Resource Manager
- Resource Manager Email
- Primary Role
- Employment Type
- Org Structure Path
- Org Structure Lowest Unit
- Last Logged in Date
- User License
- Right License
- Access Right
- Access Right Type
- Access Right to OBS
- Granted Through Type
- Granted Through (Security Group)
- Access Right Description
- Resource OBS
- Resource
- Resource Manager
- Primary Role
- Employment Type
-
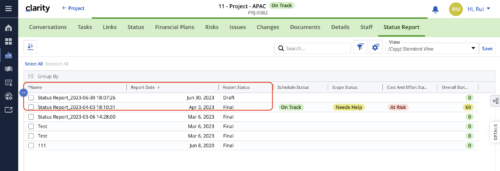 When marking a Status Report 'Final' in a grid/list view, the system doesn't create a new 'Draft' report like it does when using the Status Report UI. For groups that prefer to manage in a grid/list, they need to always have a draft.
 -
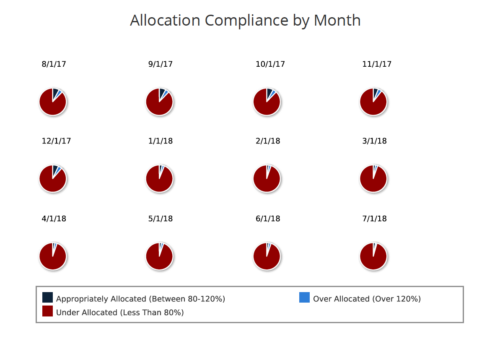 Allocation Compliance Pie Chart provides the resource manager a single place to view the Monthly Resource Allocation compliance for all resources in the form of a Pie chart. A separate Pie chart is displayed for each month. Allocation Compliance is calculated based on the value of 'Availability to Allocation Hours %'. Allocation Compliance is 'Under Allocated (Less Than 80%)' WHEN 'Availability to Allocation Hours %’ is less than 80. Allocation Compliance is 'Appropriately Allocated (Between 80-120%)' WHEN 'Availability to Allocation Hours %' is between 80 and 120. Allocation Compliance is 'Over Allocated (Over 120%)' WHEN 'Availability to Allocation Hours %' is greater than 120. User can further narrow their search by Resource Is Active? , OBS Type, OBS Path and Month Start Date. User can use exact dates or relative dates for Month Start Date filter parameter.
 -
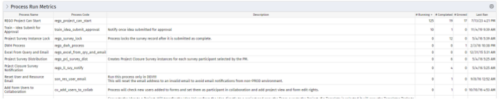 For each process, the Process Run Metrics portlet shows the Process Name, Process Code, Description, # Running, # Completed, # Errored, and Last Run Date. This portlet is ideal for system administrators and support staff needing to monitor the health of the environment. Viewers of this portlet can get a sense of the complexity & health of the environment with the # of processes running and visibility into processes that errored out. The table below describes the available filter fields in the portlet.
Column Label Description Process Name Name of the process Start Date Start date of the process’s last ran date End Date End date of the process’s last ran date Description Description of the process Process ID ID of the process -
For each process, the Process Run Metrics portlet shows the Process Name, Process Code, Description, # Running, # Completed, # Errored, and Last Run Date. This portlet is ideal for system administrators and support staff needing to monitor the health of the environment. Viewers of this portlet can get a sense of the complexity & health of the environment with the # of processes running and visibility into processes that errored out. The table below describes the available filter fields in the portlet.
Column Label Description Process Name Name of the process Start Date Start date of the process’s last ran date End Date End date of the process’s last ran date Description Description of the process Process ID ID of the process -
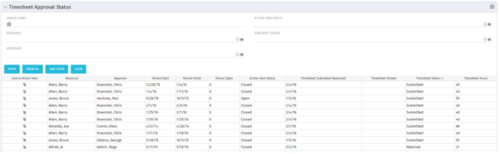 Portlet to show the stage of any Action Item triggered by Timesheet submission. Portlet allows for a period start date input, filters by Resource, Approver, Action Item Status and Timesheet Status. A link to the action item is provided for direct action by review if needed. This portlet is only for the clients who have established a process that triggers on Timesheet Status change to Submitted and to send Action Items to the person responsible for timesheet approval/validation i.e. PM for project tracking and/or RM for overall approval of the timesheet. The portlet won’t display any data if there are no timesheet Action Items. Examples of such processes would be CA’s OOTB Project Manager Approval or the Timesheet Approval - PM and RM process found on RegoXchange.
 -
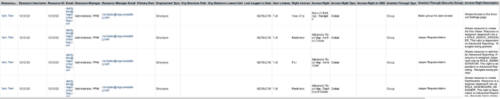
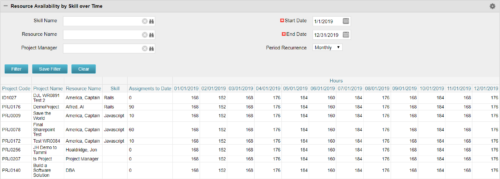 Resource Availability by Skill over Time is a grid portlet that provides Resource Managers a single place to view Resources’ skill sets along with their availability (hrs.) over a period of time. This report also displays the assigned Investments to date and the Actual hours to date for the Resource on those respective Investments. Users can further narrow their search by Skill Name, Resource Name, Project Manager, Start Date, End Date and Period Recurrence.
 -
 Out of the box, there is no way to export or report on the Modern UX Roadmap Grid view. This report allows the end user to select one or more roadmaps and provides an exportable view of several OOTB fields from those roadmaps. When exported to and open in excel, the first tab will display a combined view of all selected Roadmaps, one row for every Roadmap Item, and additional tabs will display Roadmap-specific views. Custom attributes may be added to the report by your developers.
 -
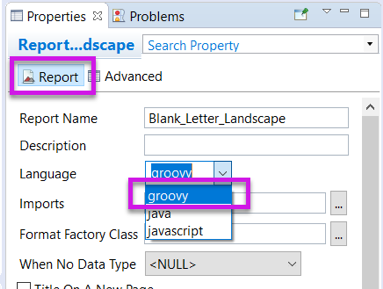 Changing the report programming language can allow the report developer to use other languages (such as Groovy or Javascript) instead of Java methods in expressions. This can be useful in debugging report code.
 -
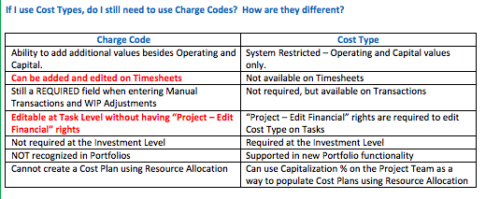 The Cost Type field was introduced in CA PPM 13.3, but had some limitations because it wasn’t available in certain financial areas. The CA PPM 14.3 release includes the addition of Cost Type in the Cost/Rate Matrix, Chargebacks, Transactions and WIP Adjustments. This Technical Trick assists you in moving from Charge Code to Cost Type.


Copyright 2023 • Rego Consulting Corporation • Privacy Policy