-
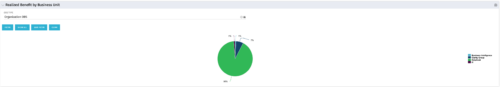 Pie Chart that aggregates Realized Benefit (Total Actual Benefit) by OBS for active projects. Only a Benefit Plan associated with the Cost Plan of Record will return data. The filter allows you to select which OBS filter you prefer to use for this pie chart, however, only an OBS associated with Projects will return data.
 -
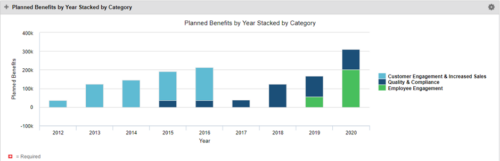 This Portlet starts by pulling Active Investments from a Classic UI Portfolio. It then looks for the Cost Plan of Record and its’ linked Benefit Plan. It then aggregates the Planned Benefit and groups it by Category, then presents a stacked bar chart.
 -
This Portlet starts by pulling Active Investments from a Classic UI Portfolio. It then looks for the Cost Plan of Record and its’ linked Benefit Plan. It then aggregates the Planned Benefit and groups it by Category, then presents a stacked bar chart.
-
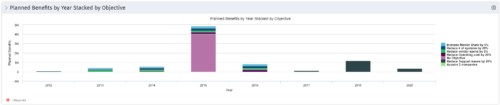 This Portlet starts by pulling Active Investments from a Classic UI Portfolio. It then looks for the Cost Plan of Record and its’ linked Benefit Plan. It then aggregates the Planned Benefit and groups it by Objective, then presents a stacked bar chart.
 -
This Portlet starts by pulling Active Investments from a Classic UI Portfolio. It then looks for the Cost Plan of Record and its’ linked Benefit Plan. It then aggregates the Planned Benefit and groups it by Objective, then presents a stacked bar chart.
-
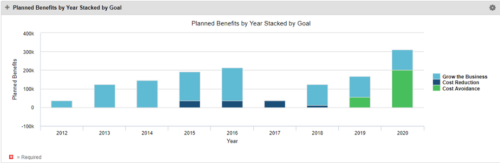 This Portlet starts by pulling Active Investments from a Classic UI Portfolio. It then looks for the Cost Plan of Record and its’ linked Benefit Plan. It then aggregates the Planned Benefit and groups it by Goal, then presents a stacked bar chart.
 -
This Portlet starts by pulling Active Investments from a Classic UI Portfolio. It then looks for the Cost Plan of Record and its’ linked Benefit Plan. It then aggregates the Planned Benefit and groups it by Goal, then presents a stacked bar chart.
-
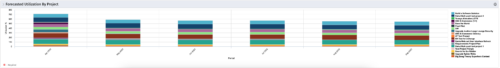 This Portlet produces a Stacked Chart of Projects using total Resource Allocation from each Project’s Team / Staff, per month. Users can specify which Resource OBS to use as a Filter (unit and descendants is assumed) as well as a Start/End Date Range.
 -
This Portlet produces a Stacked Chart of Projects using total Resource Allocation from each Project’s Team / Staff, per month. Users can specify which Resource OBS to use as a Filter (unit and descendants is assumed) as well as a Start/End Date Range.
-
 This Portlet produces a Grid View of Resources using total Resource Allocation from each Project’s Team / Staff, per month; output is expressed as a %. Users can specify which Resource OBS to use as a Filter (unit and descendants is assumed) as well as a Start/End Date.
 -
This Portlet produces a Grid View of Resources using total Resource Allocation from each Project’s Team / Staff, per month; output is expressed as a %. Users can specify which Resource OBS to use as a Filter (unit and descendants is assumed) as well as a Start/End Date.
-
This Portlet produces a Grid View of Resources using total Resource Allocation from each Project’s Team / Staff, per month; output is expressed as a %. Users can specify which Resource OBS to use as a Filter (unit and descendants is assumed) as well as a Start/End Date.


Copyright 2023 • Rego Consulting Corporation • Privacy Policy