-
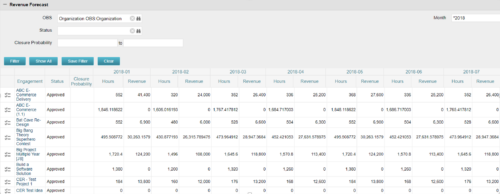
The Revenue Forecast portlet displays projected revenue at a project level broken out by month. This portlet assists in viewing all project revenue data at once and making it easily exportable. The table below describes the available filter fields in the portlet. Column Label Description OBS OBS to filter projects with Status Status of the project Closure Probability ? Months Month(s) of Project Revenue to display -

The Revenue Forecast portlet displays projected revenue at a project level broken out by month. This portlet assists in viewing all project revenue data at once and making it easily exportable. The table below describes the available filter fields in the portlet. Column Label Description OBS OBS to filter projects with Status Status of the project Closure Probability ? Months Month(s) of Project Revenue to display -

The Revenue Forecast portlet displays projected revenue at a project level broken out by month. This portlet assists in viewing all project revenue data at once and making it easily exportable. The table below describes the available filter fields in the portlet. Column Label Description OBS OBS to filter projects with Status Status of the project Closure Probability ? Months Month(s) of Project Revenue to display -
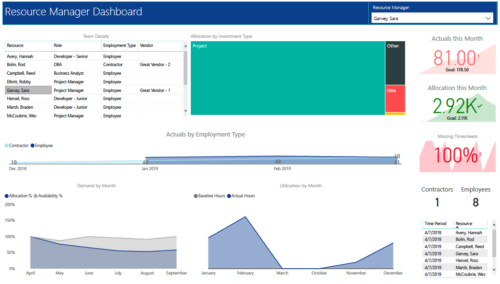 RM Dashboard shows various KPIs like Actuals posted by the resources in last month, Allocation in current month, count of missed timesheets etc. Team Details – Grid report providing list of all the resources managed by a resource manager. Allocation by Investment type – Tree graph displaying distribution pattern of allocation hours across different investment types. Actuals by Employment Type - Area graph, displaying actual hours posted by Employees Vs Contractors. Demand by Month – Area graph, displaying Allocation Vs Availability for next 6 months. Utilization by Month - Area graph, displaying Baseline Vs Actuals hours over last 6 months.
 -
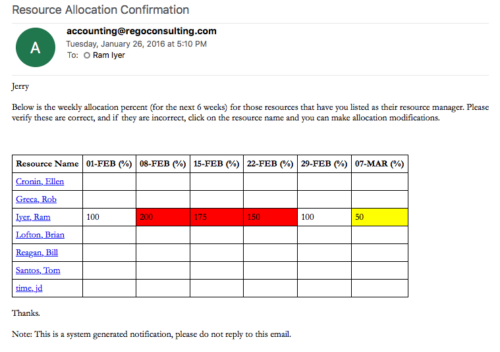
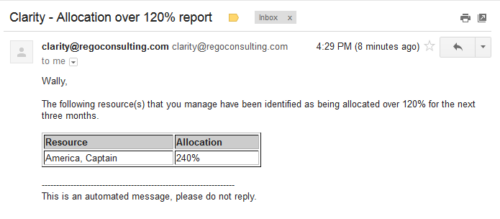 Based on the pre-determined schedule frequency, this job will send an email to Resource Managers that have a Resource meeting the criteria of: Average allocations are greater than 120% where Resource(s) and Project(s) are active over the next 90 days. This serves as a reminder to Resource Managers to monitor and manage allocations. The contents of the email include a message indicating the Resource Manager has at least one Resource meeting this criteria and a table indicating the Resource and that resource’s average, next 90 days allocations.
 -
 Based on the pre-determined schedule frequency, this job will send an email to Resource Managers that have a Resource meeting the criteria of: Average allocations are greater than 120% where Resource(s) and Project(s) are active over the next 90 days. This serves as a reminder to Resource Managers to monitor and manage allocations. The contents of the email include a message indicating the Resource Manager has at least one Resource meeting this criteria and a table indicating the Resource and that resource’s average, next 90 days allocations.
 -
 Based on the pre-determined schedule frequency, this job will send an email to Resource Managers that have a Resource meeting the criteria of: Average allocations are greater than 120% where Resource(s) and Project(s) are active over the next 90 days. This serves as a reminder to Resource Managers to monitor and manage allocations. The contents of the email include a message indicating the Resource Manager has at least one Resource meeting this criteria and a table indicating the Resource and that resource’s average, next 90 days allocations.
 -
 Based on the pre-determined schedule frequency, this job will send an email to Resource Managers that have a Resource meeting the criteria of: Average allocations are less than 100% where Resource(s) and Project(s) are active over the next two weeks. This serves as a reminder to Resource Managers to monitor and manage allocations. The contents of the email include a message indicating the Resource Manager has at least one Resource meeting this criteria and a table indicating the Resource and that resource’s average, next 90 days allocations.
 -
 Based on the pre-determined schedule frequency, this job will send an email to Resource Managers that have a Resource meeting the criteria of: Average allocations are less than 100% where Resource(s) and Project(s) are active over the next two weeks. This serves as a reminder to Resource Managers to monitor and manage allocations. The contents of the email include a message indicating the Resource Manager has at least one Resource meeting this criteria and a table indicating the Resource and that resource’s average, next 90 days allocations.
 -
 Based on the pre-determined schedule frequency, this job will send an email to Resource Managers that have a Resource meeting the criteria of: Average allocations are less than 100% where Resource(s) and Project(s) are active over the next two weeks. This serves as a reminder to Resource Managers to monitor and manage allocations. The contents of the email include a message indicating the Resource Manager has at least one Resource meeting this criteria and a table indicating the Resource and that resource’s average, next 90 days allocations.
 -
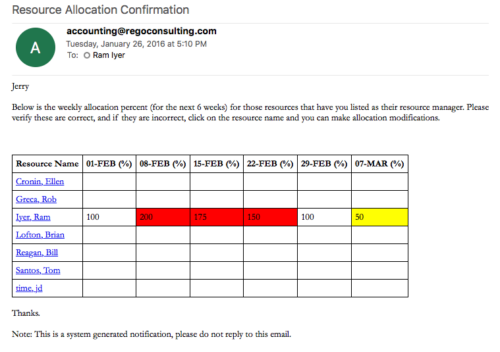 Process provides the RM with assigned resources availability percentage for the next four weeks. Grid displays all resources with their total allocated hours by week, and an average availability percent (4 Wk Avail %) for next four weeks. If % Available is negative, this indicates an over-allocation. Zero% Average Availability indicates fully allocated (no remaining availability). Links at the resource name allow for modifications by the RM.
 -
 Process provides the RM with assigned resources availability percentage for the next four weeks. Grid displays all resources with their total allocated hours by week, and an average availability percent (4 Wk Avail %) for next four weeks. If % Available is negative, this indicates an over-allocation. Zero% Average Availability indicates fully allocated (no remaining availability). Links at the resource name allow for modifications by the RM.
 -
 Process provides the RM with assigned resources availability percentage for the next four weeks. Grid displays all resources with their total allocated hours by week, and an average availability percent (4 Wk Avail %) for next four weeks. If % Available is negative, this indicates an over-allocation. Zero% Average Availability indicates fully allocated (no remaining availability). Links at the resource name allow for modifications by the RM.
 -
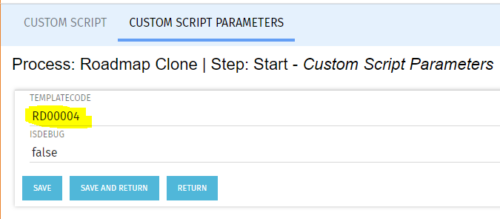
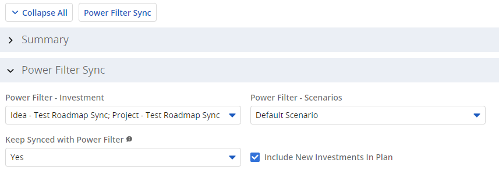 The Power Filter Sync functionality allows users to define rules for syncing investments to Roadmaps or Hierarchies on a scheduled (and on-demand in Roadmaps only) basis. Users may choose one or more saved views from investments that are allowed on the Roadmap/Hierarchy to define the list of investments they want that Roadmap/Hierarchy to contain. If the option to Keep Synced with Power Filter is set to Yes, then each time the process runs, the Investments returned by the saved views will be added to the Roadmap/Hierarchy if they don’t exist there already, and any investment not found in the saved views will be removed.
 -
 Out of the box, there is no way to export or report on the Modern UX Roadmap Grid view. This report allows the end user to select one or more roadmaps and provides an exportable view of several OOTB fields from those roadmaps. When exported to and open in excel, the first tab will display a combined view of all selected Roadmaps, one row for every Roadmap Item, and additional tabs will display Roadmap-specific views. Custom attributes may be added to the report by your developers.
 -
 Out of the box, there is no way to export or report on the Modern UX Roadmap Grid view. This report allows the end user to select one or more roadmaps and provides an exportable view of several OOTB fields from those roadmaps. When exported to and open in excel, the first tab will display a combined view of all selected Roadmaps, one row for every Roadmap Item, and additional tabs will display Roadmap-specific views. Custom attributes may be added to the report by your developers.
 -
 Do you want to talk to other customers that are using or plan to use portfolio management? In this moderated Round Table where customers can share experiences and provide insights on process, configurations, challenges, and successes. We will have an expert panel and then divide into small groups and discuss customer selected topics - 100% sharing.

