-
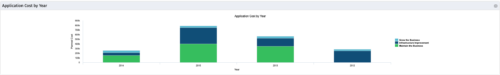 The Application Cost by Year portlet displays the active application cost by year, summarized by goal. The application cost is pulled from the application's planned cost and is displayed by year, with colors representing each application goal. This portlet provides management with a quick overview of all application costs without having to navigate to each application individually.
 -
The Application Cost by Year portlet displays the active application cost by year, summarized by goal. The application cost is pulled from the application's planned cost and is displayed by year, with colors representing each application goal. This portlet provides management with a quick overview of all application costs without having to navigate to each application individually.
-
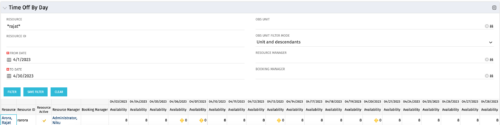 The Time Off by Day portlet displays resource availability by day. The portlet results may be filtered on: Resource Manager, Booking Manager, Resource, OBS Unit, and Date Range. This portlet will display the availability for each resource by day in separate columns and obtains the information from the time slices. When the portlet encounters an exception day (personal day off, or holiday on the base calendar), a yellow caution icon will appear within the same cell. Using this portlet, resource managers are able to quickly determine availability for their resources over a set time range.
 -
The Time Off by Day portlet displays resource availability by day. The portlet results may be filtered on: Resource Manager, Booking Manager, Resource, OBS Unit, and Date Range. This portlet will display the availability for each resource by day in separate columns and obtains the information from the time slices. When the portlet encounters an exception day (personal day off, or holiday on the base calendar), a yellow caution icon will appear within the same cell. Using this portlet, resource managers are able to quickly determine availability for their resources over a set time range.
-
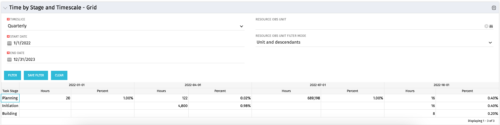 The Time by Stage and Timescale – Grid portlet displays hours for all tasks on projects by their stage for a user-defined time period. The user may narrow the results by time scale, resource OBS unit, and dates. The portlet not only provides the total hours per stage, but also the percentage of time spent on each task type. This portlet pulls data from the timeslices. Using this portlet, management can determine if excess time is being spent on a certain task stage within a project.
 -
The Time by Stage and Timescale – Grid portlet displays hours for all tasks on projects by their stage for a user-defined time period. The user may narrow the results by time scale, resource OBS unit, and dates. The portlet not only provides the total hours per stage, but also the percentage of time spent on each task type. This portlet pulls data from the timeslices. Using this portlet, management can determine if excess time is being spent on a certain task stage within a project.
-
 The Time by Stage and Timescale – Graph portlet displays a graphical representation of hours for all tasks, by stage, for a user-defined time period on projects. The user may filter the results on: Time Scale, Resource OBS Unit, and Date Range. This portlet pulls data from the timeslices. Using this portlet, management can determine if excess time is being spent on certain task stages within projects.
 -
The Time by Stage and Timescale – Graph portlet displays a graphical representation of hours for all tasks, by stage, for a user-defined time period on projects. The user may filter the results on: Time Scale, Resource OBS Unit, and Date Range. This portlet pulls data from the timeslices. Using this portlet, management can determine if excess time is being spent on certain task stages within projects.
-
The Time by Stage and Timescale – Graph portlet displays a graphical representation of hours for all tasks, by stage, for a user-defined time period on projects. The user may filter the results on: Time Scale, Resource OBS Unit, and Date Range. This portlet pulls data from the timeslices. Using this portlet, management can determine if excess time is being spent on certain task stages within projects.


Copyright 2023 • Rego Consulting Corporation • Privacy Policy