1906 results
-
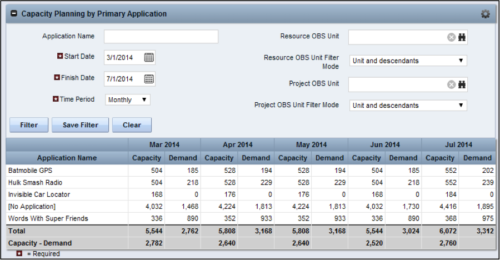 The Capacity Planning by Primary Application portlet displays the capacity and demand by primary application for a selected timeframe. This portlet is used to determine which applications are in high demand, being used efficiently, and how much capacity may be remaining for the time period. The portlet may be filtered by application name, resource OBS or project OBS to narrow the results. The timeframe can be set to display daily, weekly, monthly, quarterly, or annually.
 -
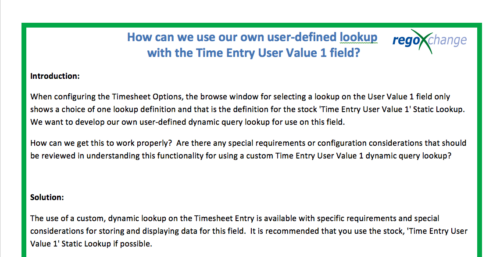 When configuring the Timesheet Options, the browse window for selecting a lookup on the User Value 1 field only shows a choice of one lookup definition and that is the definition for the stock 'Time Entry User Value 1' Static Lookup. We want to develop our own user-defined dynamic query lookup for use on this field. How can we get this to work properly? Are there any special requirements or configuration considerations that should be reviewed in understanding this functionality for using a custom Time Entry User Value 1 dynamic query lookup? The use of a custom, dynamic lookup on the Timesheet Entry is available with specific requirements and special considerations for storing and displaying data for this field. It is recommended that you use the stock, 'Time Entry User Value 1' Static Lookup if possible.
 -
 A Rego Base Training Course that reviews the Jaspersoft Ad Hoc Reporting features. Elements include an Overview, Accessing Advanced Reporting, Running a Report, Running an Ad Hoc Report, Saving and Accessing a Saved Report, Creating a Cross Tab View, Creating a Chart, Creating a Dashboard, and Scheduling a Report.
 -
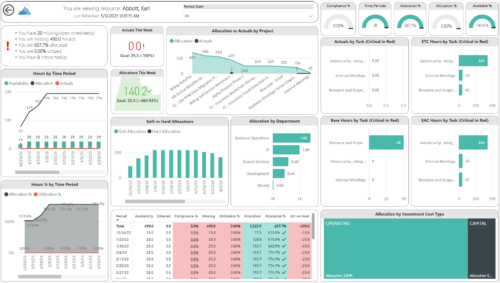
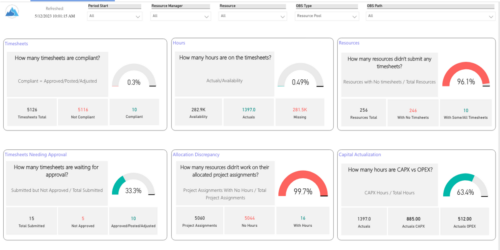 Spot opportunities to improve timesheet accuracy and resource allocations by assessing timesheet compliance and allocation. Report Views include:
- Allocation Variance
- Capex vs Opex
- Hours Detail
- Resource Dtails
- Single Manager Drill Down
- Single Resource Drill Down
- Timesheet Detail
- Timesheet Summary
- Unapproved Timesheets
-
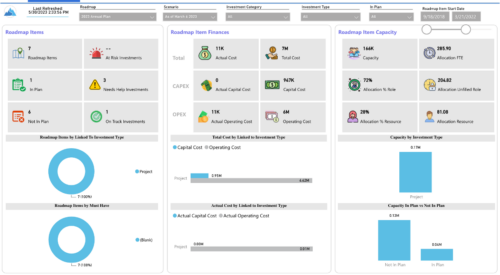
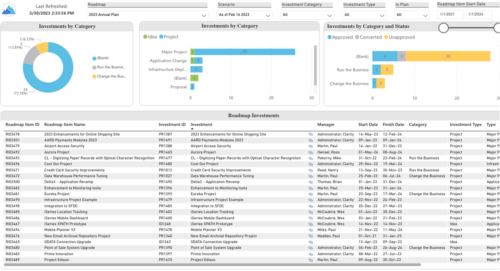 Plan your future work by comparing different scenarios, including in-flight work, and determine the best course of action for your organization. Report Views include:
- Roadmap Details
- Resource Investment Demand
- Roadmap Financials
- Roadmap Investment Gantt
- Roadmap Item Gantt
- Roadmap Overview – Default Scenarios
- Roadmap Overview – Single Roadmap Selection
- Scenario Comparison
-
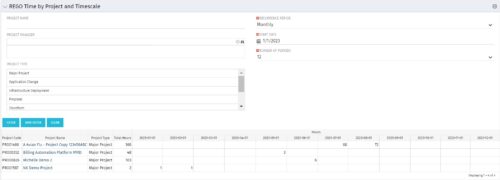 This portlet displays Actual Time by Project over a span of time. It supports Annual, Quarterly, Monthly, and Weekly time periods. The time span displayed is controlled by a filter field for the Start Date (of the time span) and by a filter field for the Number of Time Periods to be displayed. There are also filters for Project name, Project Manager, and Project Type.
 -
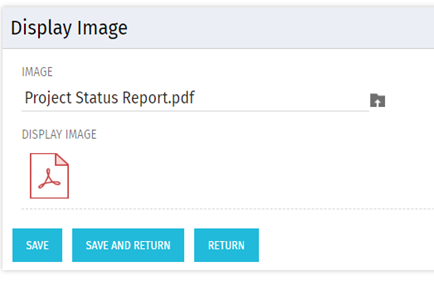 There are many times user’s wants to see the preview of file uploaded on attachment attribute. This Technical Trick will illustrate the steps for an Administrator to preview an attachment. This solution will help to preview PDF, Text file and Image(.png) file. For Microsoft word, PowerPoint and Microsoft Excel, it displays an icon.
 -
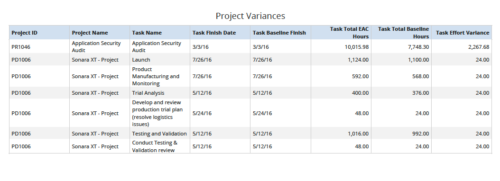 Project Variances is a grid chart that provides project managers a single place to view baseline variance at task level for various projects. This report helps managers analyze how projects are progressing against their baselines and helps them in taking correcting measures if required. You can further narrow your search by OBS Type, OBS Path, Project ID, Task Finish Date, Task Total EAC to Baseline Hours variance, Task Total EAC to Baseline Hours variance%, Task Total Baseline Hours, Task Total EAC Hours and Is Project Active?
 -
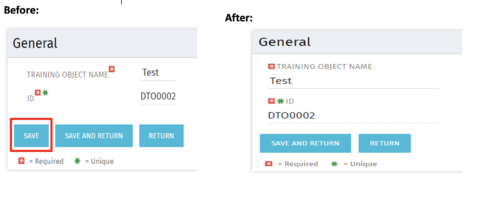 Often, you would want to disallow users from making edits to stay on the same page after changing the data by clicking Save. By forcing the users to click Save and Return, they are forced out of the page. For the above-mentioned reason, the Clarity admin can add the code in the attached tech-trick document, and that will hide the Save button from being displayed.

