-
 A Quick Reference Guide to assist in the creation of Hierarchies in Clarity’s Modern UX. Clarity PPM provides the ability to create one or more hierarchies that define the relationships between ideas, projects or custom investments. Each hierarchy contains up to a 500 tree card diagram that shows a parent-child relationship between the tree cards.
 -
 A Quick Reference Guide to assist in using the Hierarchies Grid view in Clarity’s Modern UX. The Hierarchy grid provides the ability to create new hierarchies, filter, add fields to the gird, save and load views, export the list of hierarchies and review the details of a hierarchy.
 -
 Learn how to create, manage, and analyze investment data using Clarity's Hierarchies and Roadmap modules. This course will cover best practices setup of Hierarchies along with setting targets, planning, importing/syncing, selecting views, and printing Roadmaps.
 -
 This training document is a Rego Consulting Quick Reference Guide to assist with use of the Hierarchies Card View in Clarity’s Modern User Experience.
 -
 This training document is a Rego Consulting Quick Reference Guide to assist with the creation of Hierarchies in Clarity’s Modern User Experience.
 -
 A Rego Training deck that reviews the use of Hierarchies in Clarity PPM’s Modern UX.
- Hierarchies in Clarity PPM can be used to create one or more hierarchies that define relationships between various investments. Each hierarchy includes an investment tress card made up of multiple cards.
- A parent-child relationship between investment cards help stakeholders understand the dynamics of the investments. Stakeholders can use the Hierarchies page to view all the hierarchies in the organization.
- Hierarchies can include different investment types such as; ideas, projects, and custom investments with configurable cards by investment type.
- Hierarchies can display rolled up aggregation metrics.
- Hierarchies can be exported to PDF.
-
 Hierarchies and Roadmaps are two powerful capabilities that Clarity has brought to the market. While they work great independently, have you experimented with how they can work even better together? In this session, come and learn how these two capabilities can complement each other by working in concert giving you both planning and execution insights!
 -
 Hierarchies and Roadmaps are two powerful capabilities that Clarity has brought to the market. While they work great independently, have you experimented with how they can work together, even better? In this session, come and learn how these two capabilities can complement each other by working in concert giving you both planning and execution insights!
 -
 The Hours and Cost by Vendor - Graph portlet displays vendor hour or costs by month. Using this portlet, management is provided with a graphical representation of vendor costs or hours by month for a set of time without running a report or navigating to each resource individually. This portlet uses the monthly actual timeslices. Additionally, the user must select a date range and whether to display hours or costs. Once populated, the graph will display all vendors that currently have hours and cost for the selected date range.
 -
The Hours and Cost by Vendor - Graph portlet displays vendor hour or costs by month. Using this portlet, management is provided with a graphical representation of vendor costs or hours by month for a set of time without running a report or navigating to each resource individually. This portlet uses the monthly actual timeslices. Additionally, the user must select a date range and whether to display hours or costs. Once populated, the graph will display all vendors that currently have hours and cost for the selected date range.
-
 The Hours and Cost by Vendor – Grid portlet displays vendor hour or costs by month grouped by vendor. Using this portlet, management is provided with a quick overview of vendor costs or hours by month for a set of time without running a report or navigating to each resource individually. This portlet uses the monthly actual timeslices. The user may filter by vendor, vendor ID, date, and hours/cost in addition to the start/finish and hours/cost. Once populated, the grid will display all vendors that currently have hours/cost for the selected time frame.
 -
The Hours and Cost by Vendor – Grid portlet displays vendor hour or costs by month grouped by vendor. Using this portlet, management is provided with a quick overview of vendor costs or hours by month for a set of time without running a report or navigating to each resource individually. This portlet uses the monthly actual timeslices. The user may filter by vendor, vendor ID, date, and hours/cost in addition to the start/finish and hours/cost. Once populated, the grid will display all vendors that currently have hours/cost for the selected time frame.
-
 Discover how ApptioOne and Targetprocess seamlessly integrate to combine financial and agile processes, creating a unified approach to managing your organization's technology investments. This session will explore the benefits of leveraging both tools to optimize financial management and enhance agile project delivery. Learn how to harness the power of ApptioOne and Targetprocess together to drive efficiency and achieve your organization's goals.
 -
 A presentation slide deck from Rego University 2022. A review of Broadcom’s journey to VSM.
- Why Are We Here
- Value Stream Management
- Simplify Annual Planning
- Monitor Throughout the Year
- Real Product Management
-
 A .pdf file that has the slide by slide presentation at 2015 RegoU on how other companies are using CA PPM. The agenda covers an overview, definitions, business value, key requirements and best practices.
 -
 ** No Download - Do not Add to Cart ** As the world’s largest advanced wastewater treatment plant operator, DC Water depends on a well-designed and comprehensive Project Management Office (PMO) to ensure that its 2.1 million customers have safe drinking water. In this webinar, you'll learn how DC Water joined with Rego to construct an award-winning, metrics-based PMO using Rego’s Clarity innovations. You’ll learn how their partnership resulted in a PMO that: - Drives effective Demand and Portfolio Management for IT projects and programs - Fosters real-time communication between Clarity and Microsoft 365 to keep DC Water’s Management team and Project Management community informed - Allows the IT PMO to measure progress on objectives through metrics ** No Download ** follow this link to sign up to view the recorded webinar - http://info.regoconsulting.com/how-dc-water-partnered-with-rego-march-2021
 -
 In the session we will examine the synergy between Apptio and finance applications such as Anaplan, Oracle EPMCS, OneStream, and ClearCost. Discover how Apptio, with its purpose-built IT focus, can enhance organizational planning and workforce management by integrating with finance apps. Join us to learn valuable talking points for TBM Directors and explore real-world examples of successful collaboration between finance apps and Apptio.
 -
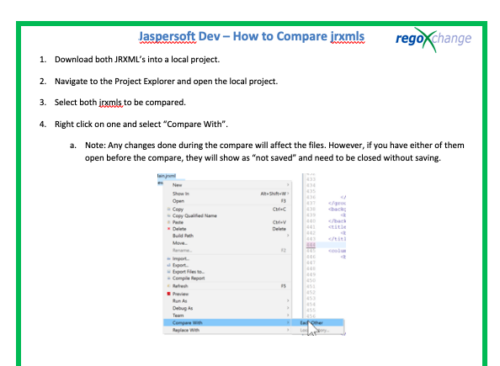 This document’s purpose is to help the reader compare jrxmls for Jaspersoft.
 -
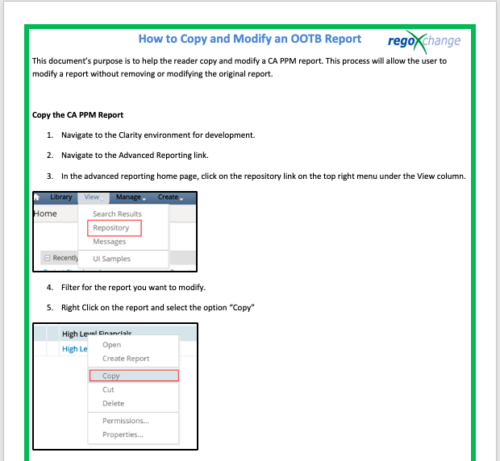 This document’s purpose is to help the reader copy and modify a CA PPM report. This process will allow the user to modify a report without removing or modifying the original report.
 -
 If you work in a busy Project Management Office (PMO), then you know that good quality data is paramount to effective planning, decision making, and project delivery. You also know that sometimes a single data point can be enhanced when it is supplemented by additional information. But as an administrator or part of the PMO, how can you guide team members to ensure they enter meaningful data into your project management system? Clarity now offers the capability to create business rules which can enforce data-entry based on the way that other attributes have been updated. In this article, you’ll get step-by-step instructions on how to update your Clarity blueprints to utilize the new Conditional Required Modal.
 -
 ** No Download - Do not Add to Cart** - Register for the White Paper at this link - http://info.regoconsulting.com/create-rmo-that-works-2020 Is your organization struggling to make sure you have the right people working on the right initiatives to meet your objectives? If so, you’re not alone. In this white paper, Rego’s Grant Zemont provides insight on what your company can do to create an RMO to get you pointed in the right direction for success.
 -
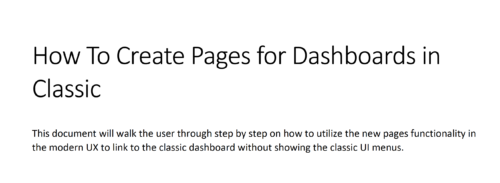 This document will walk the user through step by step on how to utilize the new pages functionality in the modern UX to link to the classic dashboard without showing the classic UI menus.


Copyright 2023 • Rego Consulting Corporation • Privacy Policy