-
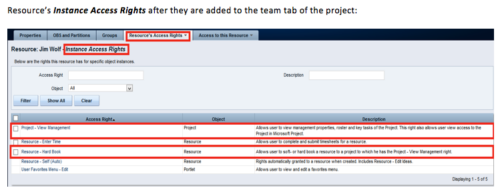 When a team member is added to the Team tab of the project, this process will add Project - View Management and Resource – Hard Book instance access right to the team member’s profile. This allows the team member to add their own allocations. NOTE: The process is NOT auto-start, and hence, needs to be run manually from Home > Organizer > Processes > Available
 -
 The Pending Contractor Termination Stalker process sends email to Resource Manager if the Contractor(s) termination date is 3 weeks or less. This is an On Demand process in Clarity named Contractor Reminders and can be manually executed from the Organizer. If there are number of processes in the Organizer – Available Processes, this process can be filtered and then checked to Start. When Contractor Reminders process is started it will be seen in the Initiated on the Processes tab. The process status can be monitored from Running to the Completed stage. The Progress when 100% and the Status is Completed an email would have arrived to the Resource Manager with subject: “Contractor(s) With Termination Date in 3 weeks or less”. This email will list the Contractors whose contracts will terminate on the identified date.
 -
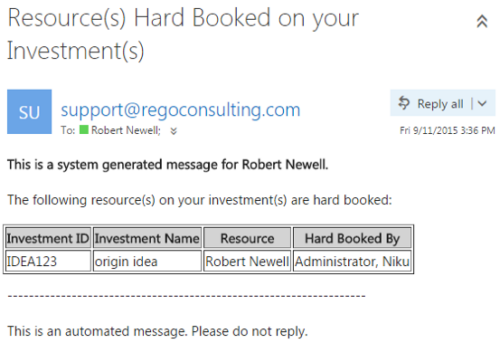 This notification process sends an email to the Manager of an investment (Project, Application, Idea, etc) when the resource assigned to the team has been hard booked. The process should be scheduled to run on a daily basis as the logic in it looks to all resources where their Booking Status has been changed from Soft to Hard on the day that the process is run. It compares the audit trail date change field to the system date. If the process is not scheduled to run daily no notification will occur on hardbookings from previous days.
 -
 This notification process sends an email to the Manager of an investment (Project, Application, Idea, etc) when the resource assigned to the team has been hard booked. The process should be scheduled to run on a daily basis as the logic in it looks to all resources where their Booking Status has been changed from Soft to Hard on the day that the process is run. It compares the audit trail date change field to the system date. If the process is not scheduled to run daily no notification will occur on hardbookings from previous days.
 -
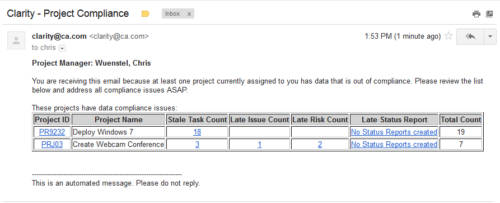 The Project Compliance Stalker – PM sends an email to Project Managers (and also their managers if so desired) at a set interval to alert them to project compliance issues. Areas of compliance that are reviewed include: stale project tasks (stale = past due date), late issues and risks (past due date) and late status reports.
 -
 Based on the pre-determined schedule frequency, this job will send an email to Resource Managers that have a Resource meeting the criteria of: Average allocations are less than 100% where Resource(s) and Project(s) are active over the next two weeks. This serves as a reminder to Resource Managers to monitor and manage allocations. The contents of the email include a message indicating the Resource Manager has at least one Resource meeting this criteria and a table indicating the Resource and that resource’s average, next 90 days allocations.
 -
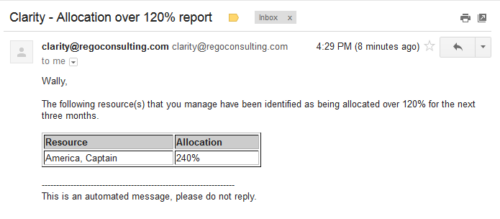 Based on the pre-determined schedule frequency, this job will send an email to Resource Managers that have a Resource meeting the criteria of: Average allocations are greater than 120% where Resource(s) and Project(s) are active over the next 90 days. This serves as a reminder to Resource Managers to monitor and manage allocations. The contents of the email include a message indicating the Resource Manager has at least one Resource meeting this criteria and a table indicating the Resource and that resource’s average, next 90 days allocations.
 -
 The Grant Team Project Edit Rights workflow allows a project manager to grant Project – Edit Management rights to all users staffed on the project. This workflow saves not only the project manager time by allowing all users on the project to update information, but also saves the administrator time from granting each resource these rights individually. The process will also remove any rights from members that have been removed from the project.
 -
 The Grant Team Project Edit Rights workflow allows a project manager to grant Project – Edit Management rights to all users staffed on the project. This workflow saves not only the project manager time by allowing all users on the project to update information, but also saves the administrator time from granting each resource these rights individually. The process will also remove any rights from members that have been removed from the project.
 -
 The Timesheet Approval - RM process is an auto-start process that begins once the resource submits his or her timesheet. This process provides a checks-and-balances style to ensure that all resources entering time have entered the 40 hours. Once the timesheet is submitted, the process will lock the user’s timesheet to prevent editing. The process will then select the next action based on three different factors:
- The timesheet has less than 40 hours.
- The timesheet has 40 or more hours.
- The resource’s availability is less than 8hrs/day.


