-
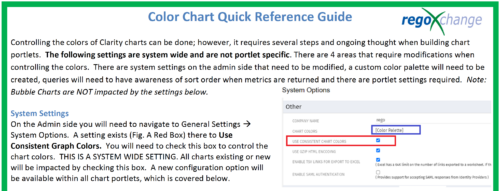 The Using Consistent Colors technical trick shows how management can create a uniform color pallet for all charts within the system. This trick, not only makes charts more professional when delivering to management, but also creates a uniform pattern throughout the Clarity environment.
 -
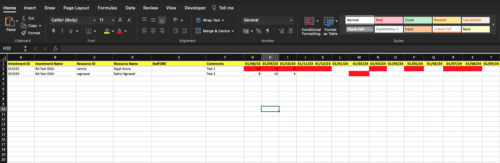
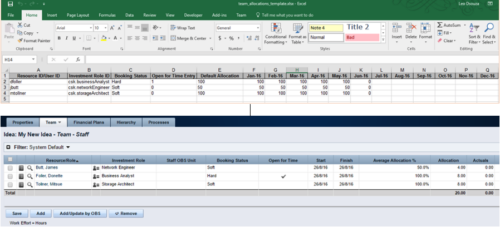 The idea allocation uploader allows you to import in allocations from an external Excel spreadsheet. Populate an Excel template with required fields then import them directly from the Clarity UI. Once imported you’ll see the allocations right on the Team tab of the Idea.
 -
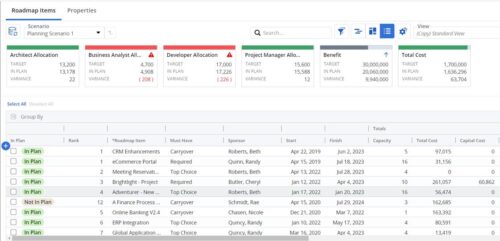 This Roadmap add-on provides configurable Role-based metrics that can be used in the grid view as targets and constraints. Select your valuable roles in the “targets” and once selected, the “sync” button will bring in any current allocations against projects and allow editing any of the total numbers directly in a scenario. This will provide deeper insights into impacts of plans on teams/resources in addition to the out of the box money and time constraints.
 -
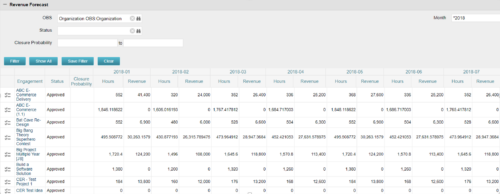
The Revenue Forecast portlet displays projected revenue at a project level broken out by month. This portlet assists in viewing all project revenue data at once and making it easily exportable. The table below describes the available filter fields in the portlet. Column Label Description OBS OBS to filter projects with Status Status of the project Closure Probability ? Months Month(s) of Project Revenue to display -
The Revenue Forecast portlet displays projected revenue at a project level broken out by month. This portlet assists in viewing all project revenue data at once and making it easily exportable. The table below describes the available filter fields in the portlet. Column Label Description OBS OBS to filter projects with Status Status of the project Closure Probability ? Months Month(s) of Project Revenue to display -
The Revenue Forecast portlet displays projected revenue at a project level broken out by month. This portlet assists in viewing all project revenue data at once and making it easily exportable. The table below describes the available filter fields in the portlet. Column Label Description OBS OBS to filter projects with Status Status of the project Closure Probability ? Months Month(s) of Project Revenue to display -
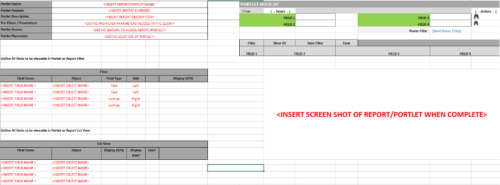 This Excel document provides a template for mocking up and validating portlet requirements. The template is important to use to help end users visualize the final output of a portlet. Template Defines:
- Portlet Name
- Portlet Purpose
- Portlet Description
- Portlet Security
- Portlet Placement
- Portlet Filter Fields/Layout
- Portlet Grid Fields/Layout
-
 This document will walk the user through step by step on how to utilize the new pages functionality in the modern UX to link to the classic dashboard without showing the classic UI menus.
 -
 This video provides an overview of utilizing the various views available within Open WorkBench. The video is available in both .m4v and .wmv formats.
 -
 This video describes the process of creating new tasks and working with the Work Breakdown Structure (WBS) within Open WorkBench. The video is available in both .m4v and .wmv formats.
 -
 This video describes how to create and work with task dependencies within Open WorkBench. The video is available in both .m4v and .wmv formats.
 -
 This video describes the process to assign resources to tasks within OWB. The video is available in both .m4v and .wmv formats.


Copyright 2023 • Rego Consulting Corporation • Privacy Policy