-
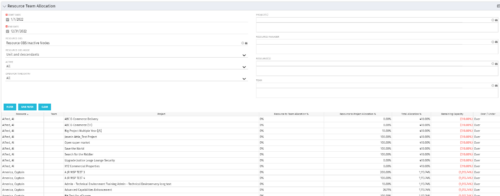
 This portlet displays the % allocation of resources to projects. The portlet shows if the resource is allocated to the projects as an individual resource or as part of an Agile team, in which case it will display the resource % allocation to the team and what that will represent in terms of % allocation to the project. The Total Allocation % display the allocation of the resource to all investments is allocated to. Remaining Capacity and Over/Under columns will help identify the resources that still have availability and the ones that are over allocated.
 -
 The Resources Demand Summary portlet displays the total Estimate to Complete (ETC’s) for Resources. The portlet displays the total per time scale value selected per resource and a grand total of all ETC’s for the selected time period. Filtering capabilities allow the user to filter by an individual resource, resource manager, time scale values, dates, and OBS. The portlet provides a Resource Manager with a single location to view ETC’s by Resource.
 -
 The Resources Demand Summary portlet displays the total Estimate to Complete (ETC’s) for Resources. The portlet displays the total per time scale value selected per resource and a grand total of all ETC’s for the selected time period. Filtering capabilities allow the user to filter by an individual resource, resource manager, time scale values, dates, and OBS. The portlet provides a Resource Manager with a single location to view ETC’s by Resource.
 -
 The Resources Demand Summary portlet displays the total Estimate to Complete (ETC’s) for Resources. The portlet displays the total per time scale value selected per resource and a grand total of all ETC’s for the selected time period. Filtering capabilities allow the user to filter by an individual resource, resource manager, time scale values, dates, and OBS. The portlet provides a Resource Manager with a single location to view ETC’s by Resource.
 -
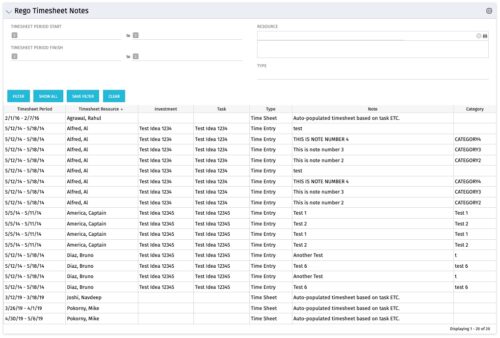
 The Timesheet Notes portlet displays all timesheet notes split out by resource, investment and task. This is very useful in situations where you want to review multiple notes as you do not have to open each note separately. The table below describes the available filter fields in the portlet.
Column Label Description Timesheet Period Start Range of time periods to display filtered by start date Timesheet Period Finish Range of time periods to display filtered by finish date Resource Resource(s) to display Type Note on a timesheet or time entry (task specific) -
 The Timesheet Notes portlet displays all timesheet notes split out by resource, investment and task. This is very useful in situations where you want to review multiple notes as you do not have to open each note separately. The table below describes the available filter fields in the portlet.
Column Label Description Timesheet Period Start Range of time periods to display filtered by start date Timesheet Period Finish Range of time periods to display filtered by finish date Resource Resource(s) to display Type Note on a timesheet or time entry (task specific)


