-
 Today, most high-performing organizations recognize that moving from project-funding to product-funding is necessary for achieving business agility. What doesn't exist in the industry is guidance on how to support the transition from a tooling perspective. In this session, Rego Expert Guide Robert Sirard presents a practical and tactical approach to using Clarity's PPM software and Rally's Agile software together to plan, track, monitor, and deliver products. At Rego, we realize that not everything needs to be done in an Agile manner, so Robert will discuss how this approach also supports a mix of traditional and Agile investments. ** No Download - Do not Add to Cart ** There is no download for this content. Follow the link to view - http://info.regoconsulting.com/product-funding-clarity-rally-may-2021
 -
 Move to the cloud. It’s a refrain that’s become frequent and familiar to organizations of all sizes. Choosing software-as-a-service (SaaS) over traditional on-premise software is generally a no-brainer these days for standard user apps. But do the same advantages apply to data-intensive systems like Clarity PPM? This paper explores the pros and cons of transitioning from on-premise Clarity PPM to its cloud alternative. This White Paper is downloaded from the Rego Consulting site. You will be asked to provide your email address and current ppm tool. - http://info.regoconsulting.com/cappm-onpremise-or-saas-wp ** No Download - Do not Add to Cart **
 -
 Project & Portfolio Management is a Significant Investment. How do you get the most return on your investment? How do you squeeze the most value out of the processes and functionalities it provides? How do you make sure your PPM assets align with your current and future objectives? Like many business problems, the answer lies partly in asking the right questions. So let’s start there. In this white paper, we’ll review a broad array of questions you should be asking your PPM vendor to make sure you’re making the right choices, whether you’re considering a potential implementation or optimizing your current PPM environment. This White Paper is downloaded from the Rego Consulting site. You will be asked to provide your email address and current ppm tool. - http://info.regoconsulting.com/select-best-ppm-vendor ** No Download - Do not Add to Cart **
 -
 Finding the right project manager can be tricky. How do you know which candidates have the appropriate leadership, forecasting, and problem-solving skills? Interviewing strategies can make all the difference. This paper discusses important ways you can prepare for a project manager interview. It points out hazards to sidestep and best practices for identifying candidates with the right proficiency. This White Paper is downloaded from the Rego Consulting site. You will be asked to provide your email address and current ppm tool. - http://info.regoconsulting.com/how-to-hire-the-right-pm ** No Download - Do not Add to Cart **
 -
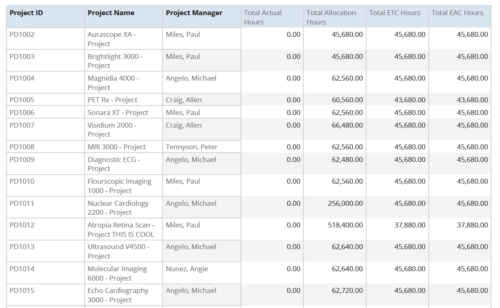 Project Time Summary report provides the project manager a single place to view Actual hours, Allocation hours, ETC hours and EAC hours for all filtered projects. It also displays Project ID, Project Name and Project Manager. User can further narrow their search by OBS Type & Path, Project Name, Project ID, Project Manager, Task Name, Project Status, Project Stage, Project Role, Is Active? and Is Template?.
 -
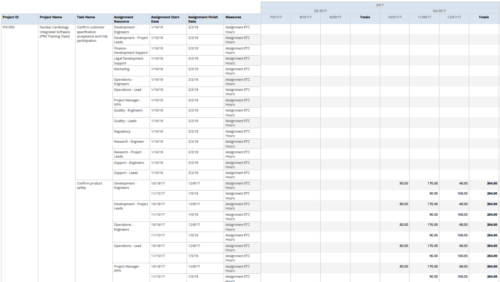 Assignments by Task Over Time report display all assignments by task for all resources. Information can be drilled down to yearly, quarterly or monthly level. This report helps in determining the tasks a user is assigned to or how many hours a user is assigned to a task. You can further narrow your search by OBS Type & Path, Project ID, Project Name, Task Name, Assignment Resource, Is project Active?, Is Template? And Month End date.
 -
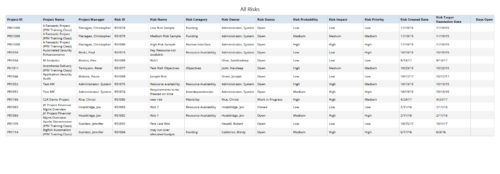 All Risks report provides the project manager a single place to view risks across multiple projects. This report displays Project Information such as ID & Name, Risk Information such as its ID, Category, Owner, Status, Probability, Impact, Priority, Created Date, Target Resolution Date & Days Open. You can further narrow your search by Risk Status, Risk Name, Risk Category, Risk Impact, Risk Priority, Risk Owner, Project Name and Project Manager.
 -
 Course description: “Are you ready to go beyond simple graph and grid portlets? This class will show you how to create and export portlets with hierarchical structure and drill-down capability, and includes examples of advanced portlets and complex queries.” Download file is the presentation slide deck.

