
- Allocation Variance
- Capex vs Opex
- Hours Detail
- Resource Dtails
- Single Manager Drill Down
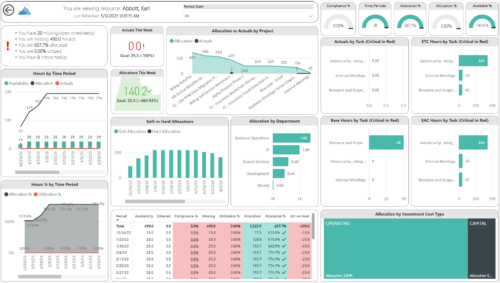
- Single Resource Drill Down
- Timesheet Detail
- Timesheet Summary
- Unapproved Timesheets
-
 Spot opportunities to improve timesheet accuracy and resource allocations by assessing timesheet compliance and allocation. Report Views include:
 -
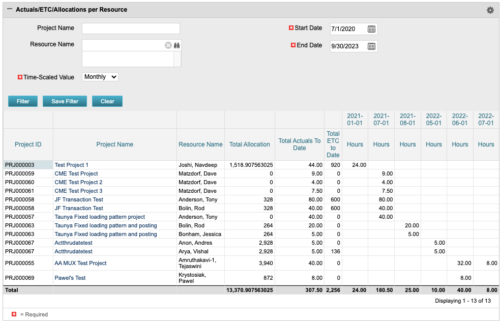
 Actuals & ETC by Resource Assignment report provides project managers a single place to view Actuals and ETC associated with resources across multiple Tasks and Projects. It displays the following: Actual and ETC Hours by Start Date: Stacked Column chart that displays the total Actual hours and ETC hours per month of fiscal period. Grey color indicates Actuals and Purple indicates ETC hours during that month. Grid: Displays Investment name, Task, Assigned resource ETC and Actual hours per month of fiscal period. It also displays aggregated column and row totals for Actuals and ETC hours. You can further narrow your search by OBS Type, OBS Path & Start Date range.
 -
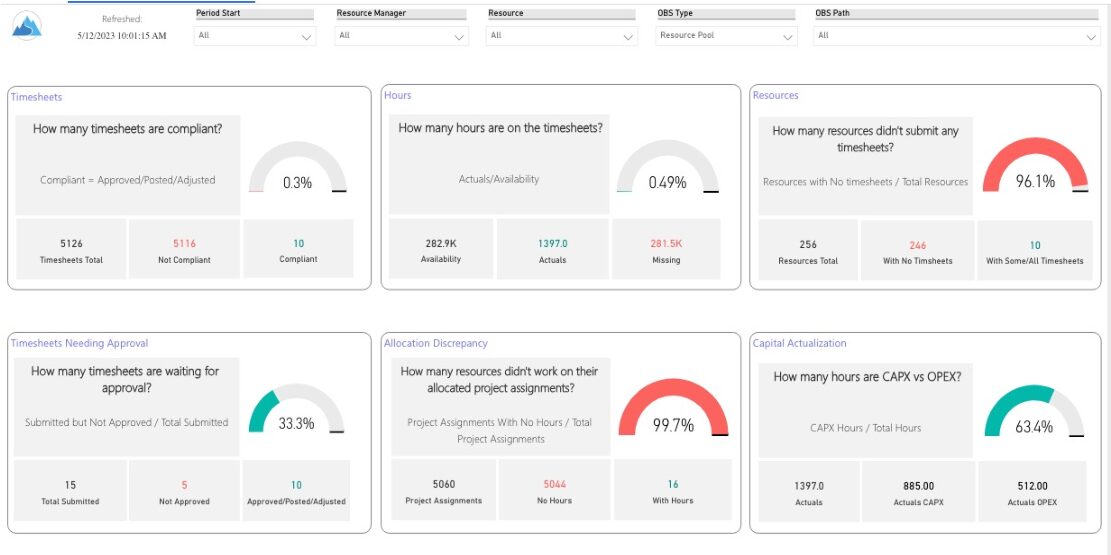
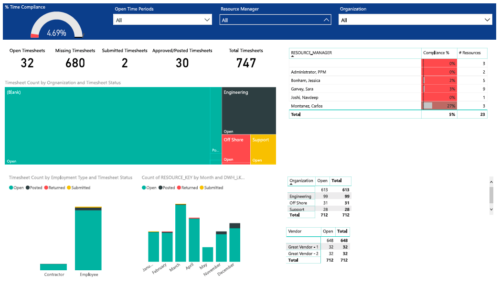 Timesheet compliance is a dashboard containing multiple visualizations that shows timesheet compliance data under various scenarios. Dashboard shows count of timesheets grouped by Status and total available timesheets. % Time Compliance – Gauge graph that shows percentage of completed timesheets against overall timesheets. Compliance by Resource Manager – Grid section that shows percent timesheet compliance by resource manager. Timesheet count by Employment type and Timesheet Status – Stacked column chart, each column represents Employment type and sections of the column represent count of timesheets by Status. Count of Timesheets by Months – Stacked column chart, each column represents a month and sections of the column represent count of timesheets by Status. Dashboard also const of two grid sections displaying number of Open timesheets by Organization and Vendor.
 -

Rego’s Clarity Adoption Metrics package consists of two sets of metrics: Project metrics, and Resource metrics. Project metrics measure how effectively project managers are using Clarity to manage their projects. Resource metrics measure how effectively resource managers are using Clarity to manage resources. Metrics are scored on a scale of 0 to 5, with higher scores indicating greater adoption and use. All metrics can be viewed numerically or graphically, and can be broken out by OBS. In addition, metric data can display as a 12-month rolling history to help identify trends. Project metrics can also display by lowest / highest adoption rates for a specific resource metric or all resource metrics. There is a variety of way to view the Adoption Metric data, therefore, Rego has made this simple by creating an Adoption Metrics object that contains multiple tabs. Each tab displays one or more of the Project or Resource Adoption Metrics. Based on the nature of the Metrics some tabs will allow the ability to use a pull down menu to select a specific Adoption Metric. There is also a Metrics trending view that pulls monthly snapshots of the metrics. Project metrics consist of the following: - Project Status Reporting – Measures how well PMs create and publish project status reports.
- Project Risk Adoption – Measures how well Risks are being used and managed.
- Project Issue Adoption – Measures how well Issues are being used and managed.
- Project Schedule – Measures how well PMs create tasks and keep the project schedule current.
- Project Baseline – Measures whether or not baselines exist.
- Project Zero ETC’s – Measures how well the PM assigns resources to tasks with ETCs.
- Project Past ETC’s – Measures how many improperly scheduled tasks the PM has.
- Project Milestone / Key Tasks – Measures how well PMs create and manage Milestones / Key Tasks.
- Project Schedule Variance – Measures how effectively PMs manage their schedules.
- Project Effort Variance – Measures how effectively PMs manage their project efforts.
- Project Budget Variance – Measures how effectively PMs manage budgets or cost plans.
- Project Unfilled Roles – Measures project roles with allocations that are already started or starting within the next 30 days.
- Project Data Quality – Measures how effectively PMs complete the Description, Stage, Progress, Objective, and Sponsor/Business Owner fields.
- Project Commitment – Measures the hard allocations for a project over a two week time frame.
- Resource Clarity Usage – Measures how often users log into Clarity.
- Resource Timesheet – Measures if timesheets post in a timely manner.
- Resource Allocation – Measures how well RMs keep total resource allocations within the expected range for future time periods.
- Resource Actualy Utilization – Measures how well Resource allocations match actuals.
- Resource Allocation Date in the Past – Measures how many resources are open for time entry with dates in the past.
- Resource Data Quality – Measures how well RMs complete the Resource Manager and Primary Role fields and optionally the Skill and Employment Type fields.
- Resource Commitment – Measures how much resource available time is committed to projects.
-
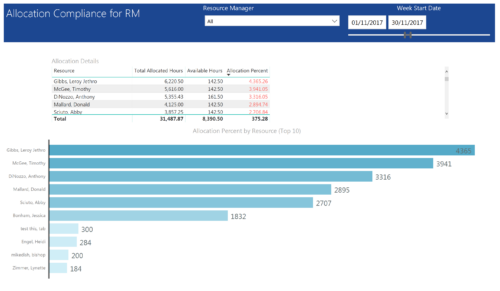 Allocation Compliance by RM report provides resource managers a single place to view Available hours, Allocation Hours and Allocation Percentage of Resources. It considers the resources of selected resource manager and it displays the following: Allocation Details Grid: Displays Resource and its Allocated hours, Available hours and Allocation percentage (Allocated hours/Available Hours) Allocation Percent by Resource: Bar chart that displays Allocation Percentage (top 10) for various resources during the selected Time frame. You can further narrow your search by Resource Manager & Month Start Date range.
 -
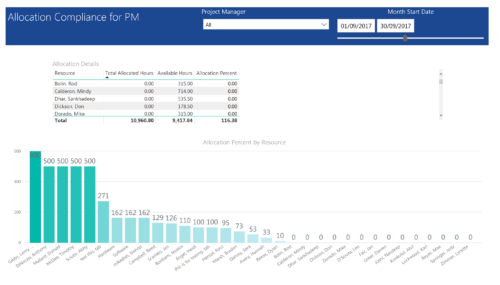 Allocation Compliance by PM report provides project managers a single place to view Available hours, Allocation Hours and Allocation Percentage of Investment Team Resources. It considers the investments of selected project manager and it displays the following: Allocation Details Grid: Displays Resource and its Allocated hours, Available hours and Allocation percentage (Allocated hours/Available Hours) Allocation Percent by Resource: Column chart that displays Allocation Percentage for various resources during the selected Time frame. You can further narrow your search by Project Manager & Month Start Date range.
 -
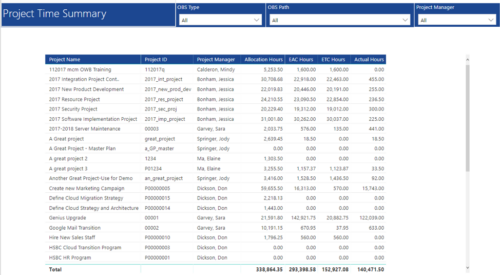 Project Time Summary report provides view of Allocation hours, EAC hours, ETC hours and Actual hours for Projects. User can further narrow their search by OBS Type & Path and Project Manager.
 -
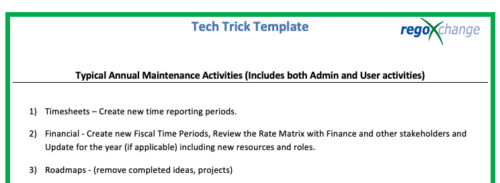 This is a list of 12 typical maintenance items that should be completed for Clarity on an annual basis. There is also a short list of items that should be completed periodically depending on client policies.
 -
 A slide deck that reviews the processes for time entry and approval of timesheets in Clarity’s Modern UX. Used for Rego’s training engagements, it covers the Time Entry process via flow chart, steps for submitting a timesheet, adjusting a returned timesheet, and adding or removing tasks from a timesheet.
 -
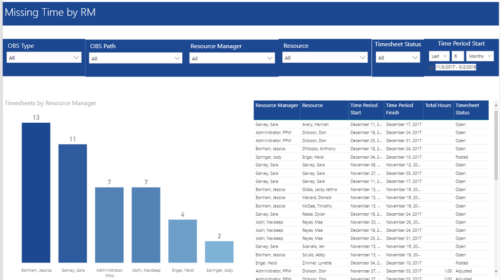 Missing Time by RM report displays Resources whose timesheets are missed by Resource Manager. There is Clustered Column Chart which displays missed timesheets count by Resource Manager. Also, there is table view of Resource Manager, Resource, Time Period Start and Finish Dates, Total Hours and Timesheet status. User can narrow their search by OBS Type & Path, Resource Manager, Resource, Timesheet Status and Time Period Start Date (Relative or Specific Date Range).
 -
 This training document is a Rego Consulting Quick Reference Guide to assist with the process of entering and submitting timesheets in Clarity’s Modern User Experience. The document reviews Accessing and Selecting Timesheets, Population of the Timesheet, and Updating Time & Submitting.
 -
 This training document is a Rego Consulting Quick Reference Guide to assist with timesheet approval in Clarity’s Modern UX. The doc reviews Accessing and Selecting Timesheets, Reviewing Submitted Timesheets, Approving Timesheets, Returning Timesheets and the Timesheet Grid.
 -
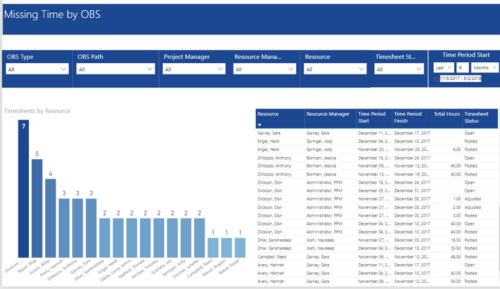 Missing Time by OBS report displays Resource whose timesheets are missed. There is Clustered Column Chart which displays Timesheets count by Resource. Also, there is table view of Resource, Resource Manager, Time Period Start and Finish Dates, Total Hours and Timesheet status. User can narrow their search by OBS Type & Path and Project Manager, Resource Manager, Resource, Timesheet Status and Time Period Start Date (Relative or Specific Date Range).
 -
 You are no longer regulated to the desktop browser to respond to action items. Learn how Rego solved this problem using just your email. We’ll talk about various use cases where you would get maximum benefit from a simple response on an action item directly from your email. It doesn’t matter if you are using email on your desktop, laptop, phone or tablet. The Action Item Responder as you covered.
 -
 This training document is a Rego Consulting Quick Reference Guide to assist Admins with Timesheet settings.
 -
 This training document is a Rego Consulting Quick Reference Guide to assist with adjustments to timesheet in Clarity’s Modern User Experience.
 -
Rego’s Clarity Adoption Metrics package consists of two sets of metrics: Project metrics, and Resource metrics. Project metrics measure how effectively project managers are using Clarity to manage their projects. Resource metrics measure how effectively resource managers are using Clarity to manage resources. Metrics are scored on a scale of 0 to 5, with higher scores indicating greater adoption and use. All metrics can be viewed numerically or graphically, and can be broken out by OBS. In addition, metric data can display as a 12-month rolling history to help identify trends. Project metrics can also display by lowest / highest adoption rates for a specific resource metric or all resource metrics. There is a variety of way to view the Adoption Metric data, therefore, Rego has made this simple by creating an Adoption Metrics object that contains multiple tabs. Each tab displays one or more of the Project or Resource Adoption Metrics. Based on the nature of the Metrics some tabs will allow the ability to use a pull down menu to select a specific Adoption Metric. There is also a Metrics trending view that pulls monthly snapshots of the metrics. Project metrics consist of the following: - Project Status Reporting – Measures how well PMs create and publish project status reports.
- Project Risk Adoption – Measures how well Risks are being used and managed.
- Project Issue Adoption – Measures how well Issues are being used and managed.
- Project Schedule – Measures how well PMs create tasks and keep the project schedule current.
- Project Baseline – Measures whether or not baselines exist.
- Project Zero ETC’s – Measures how well the PM assigns resources to tasks with ETCs.
- Project Past ETC’s – Measures how many improperly scheduled tasks the PM has.
- Project Milestone / Key Tasks – Measures how well PMs create and manage Milestones / Key Tasks.
- Project Schedule Variance – Measures how effectively PMs manage their schedules.
- Project Effort Variance – Measures how effectively PMs manage their project efforts.
- Project Budget Variance – Measures how effectively PMs manage budgets or cost plans.
- Project Unfilled Roles – Measures project roles with allocations that are already started or starting within the next 30 days.
- Project Data Quality – Measures how effectively PMs complete the Description, Stage, Progress, Objective, and Sponsor/Business Owner fields.
- Project Commitment – Measures the hard allocations for a project over a two week time frame.
- Resource Clarity Usage – Measures how often users log into Clarity.
- Resource Timesheet – Measures if timesheets post in a timely manner.
- Resource Allocation – Measures how well RMs keep total resource allocations within the expected range for future time periods.
- Resource Actualy Utilization – Measures how well Resource allocations match actuals.
- Resource Allocation Date in the Past – Measures how many resources are open for time entry with dates in the past.
- Resource Data Quality – Measures how well RMs complete the Resource Manager and Primary Role fields and optionally the Skill and Employment Type fields.
- Resource Commitment – Measures how much resource available time is committed to projects.
-
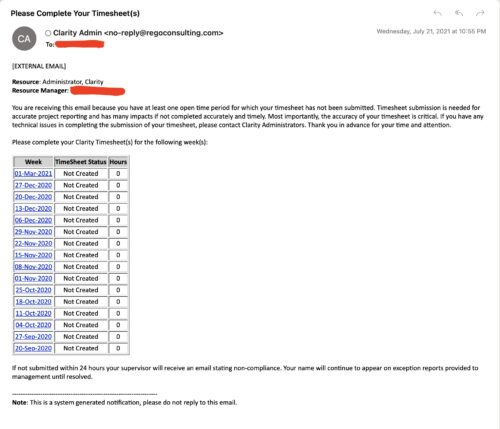
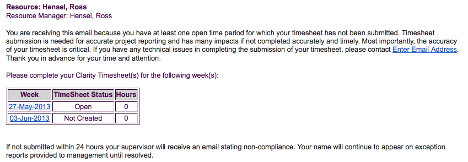 The Enhanced Time Tracking Stalker – Resource workflow process is used to notify resources who failed to submit a timesheet for the prior time period they must take action. The workflow checks for active resources (by using the hire and termination dates, their track mode and that they are open for time entry). Each resource who meet the criteria receives an email asking them to submit their outstanding timesheet(s). The email includes a table that contains this information: time period, timesheet status and any hours currently saved on the timesheet. All outstanding timesheets are included in the table with links to the timesheet in the Modern User Experience side of Clarity. This process helps to ensure the timely submission of timesheets.
 -
 You are no longer regulated to the desktop browser to respond to action items. Learn how Rego solved this problem using just your email. We’ll talk about various use cases where you would get maximum benefit from a simple response on an action item directly from your email. It doesn’t matter if you are using email on your desktop, laptop, phone or tablet. The Action Item Responder as you covered.
 -
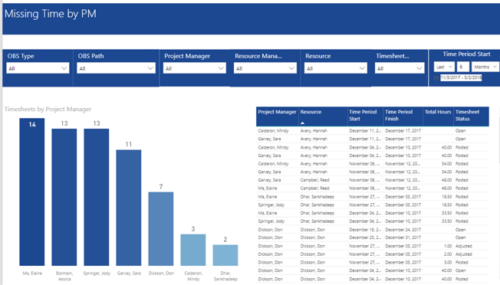 Missing Time by PM report displays Resources whose timesheets are missed by Project Manager. There is Clustered Column Chart which displays missed timesheets count by Project Manager. Also, there is table view of Project Manager, Resource, Time Period Start and Finish Dates, Total Hours and Timesheet status. User can narrow their search by OBS Type & Path and Project Manager, Resource Manager, Resource, Timesheet Status and Time Period Start Date (Relative or Specific Date Range).
 -
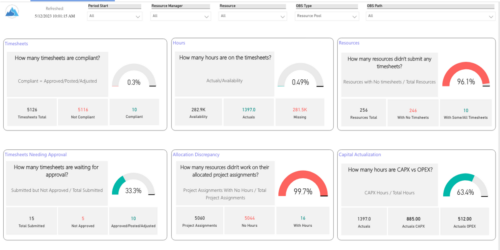
 Spot opportunities to improve timesheet accuracy and resource allocations by assessing timesheet compliance and allocation. Report Views include: • Allocation Variance • Capex vs Opex • Hours Detail • Resource Dtails • Single Manager Drill Down • Single Resource Drill Down • Timesheet Detail • Timesheet Summary • Unapproved Timesheets Demo Video: https://www.youtube.com/watch?v=yxIkkqSyrRU&list=PLXJ5ktuWV0jiS9CvBpHvBIwpKPmA9uvwK&index=8
 -
 This training document is a Rego Consulting Quick Reference Guide to assist with Time Entry Administration Settings for Timesheets. This doc references version 16.3 views. Document provides detail on Timesheet Options for the Modern UX and how to enable end user column configuration. Detail is also provided on how end users may configure their timesheet view.
 -
 The portlet displays posted time by project for the logged in user based on time period and date range. This allows the user to see at a glance their ETC and actuals on the projects. The portlet displays the Total Allocation and Total Actuals to Date for the user on the projects they are allocated/assigned to. The actuals are displayed per month in the form of TSVs.
 -
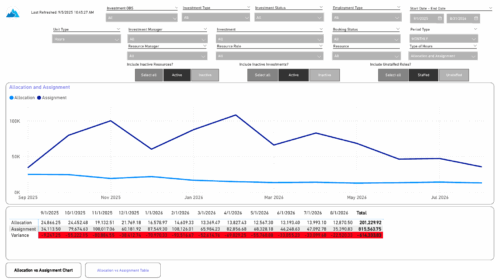 The Investment Allocations and Assignments report provides visibility into team member allocation, task assignment, and variance amounts by investment across time periods. A chart highlights allocation compared to assignment amounts by period. Results can be displayed by week, month, or in total, and viewed in either hours or FTEs for each team member and investment. Interactive visuals make it easy to compare planned effort against actual assignments at the team member and investment level. Content Type: Business Intelligence, PowerBI Report
 -
 This training document is a Rego Consulting Quick Reference Guide to assist resource managers with the adjusting of timesheets. This doc references version 16.3 views. Document provides guidance on how to use the Review & Approve tab to adjust time that has already been entered by a resource.
 -
 The Enhanced Time Tracking Stalker – RM workflow process automatically sends a single email to Resource Managers which contains a list of any of their resources that have not submitted their timesheet for a prior open time period. The email informs the RM if their resources are submitting their timesheets on time. The email includes a table that provides this information for each resource: Resource Name, Time Period, Timesheet Status and Total Hours saved on the timesheet with links to the timesheet in the Modern User Experience of Clarity. These notifications will help to ensure that time is being posted and approved in a timely manner.
 -
 This training document is a Rego Consulting Quick Reference Guide to assist with Entering and Submitting Time in Clarity’s Modern User Experience. This doc references version 16.3 views. Document includes Accessing & Selecting Timesheets, Populate Timesheet, Updating Timesheet, Submitting Timesheet and Entering Time for Someone Else.
 -
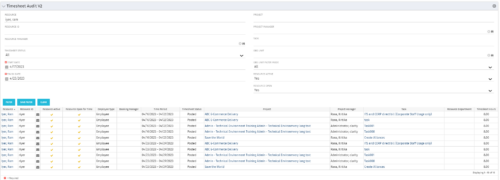 The Timesheet Audit portlet displays timesheet information in order to perform an audit. The only required data needed to search the portlet is start and finish date. Additionally, you may narrow the results by filtering by resource, resource ID, OBS Unit, resource manager, timesheet status, project, and task. The portlet provides reporting on the following:
- Resource
- Resource ID
- Email Icon of Resource (So the reviewer can quickly email the Resource)
- Resource is Active
- Resource Open for Time
- Time Period (Start and Finish Dates)
- Timesheet Status
- Is Adjustment (If the timesheet is adjusted)
- Timesheet Modified Date
- Timesheet Posted Date
- Timesheet Submitted By
- Timesheet Approved By
- Project
- Task
- Proposed ETC Hours
- Pending Actual Hours
- Total Actual Hours
-
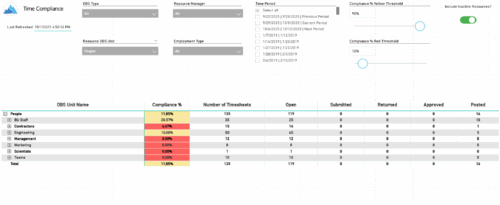 The Time Compliance report displays the timesheet compliance percent, the number of timesheets by status (open, submitted, returned, approved, and posted), and the total for each OBS unit, with the ability to filter and drill down.
 -
 This training document is a Rego Consulting Quick Reference Guide to assist resource managers with the approval of timesheets via the Review & Approve tab. This doc references version 16.3 views. Doc reviews accessing and selecting timesheets, reviewing submitted timesheets, approving timesheets, approving multiple timesheets, returning timesheets and the timesheet grid.
 -
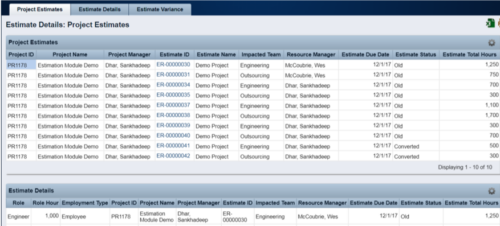 The Rego Estimation Module Provides a more accurate estimate earlier in the idea/project lifecycle.
- Is applied consistently so it can be improved.
- Retains the data in Clarity to enable analysis.
- Provides ongoing feedback by comparing estimates to current EAC.
- Provides historical record of estimating for projects overall as well as change requests.
-
 Have you looked in the regoXchange or reviewed Rego’s innovation offerings? This class will show you the power of Rego’s pre-built content library, integrations, and other assets. See example after example of portlets, processes, and materials you can use to add value to your instance of Clarity. Learn how you can introduce email-based approvals with Rego's action item responder. Get a peek at Rego's new MSP integration that avoids the issues faced with the OOTB integration. Finally, understand Rego's pre-built connectors and how they can benefit your instance. Including blueprint migrator. Include free tools like GEL builder, query, XOGbridge.
 -
The Auto-Approve Old Timesheets workflow process can be run through the "Execute a Process" job and may be used to quickly close out timesheets for a specified timeframe for period closure. The workflow will execute a query that will automatically approve ALL (no matter the status of the timesheet) timesheets that have a time period start date before the Approve Date specified within the process itself.
-
 The Rego PowerBI Reporting Suite features close to 100 free PowerBI reports, designed to enhance project management and reporting capabilities.
 -
 Do you want to add interfaces to your CA PPM instance? This class will review the pros and cons of various integration methods and provide best practice on how to handle various interfaces. We’ll walk you through specific interface examples and showcase Rego’s pre-built interface sets you can leverage to reduce the time and cost of implementation.
 -
This training document is a Rego Consulting Quick Reference Guide to assist with Entering and Submitting Time in Clarity’s Modern User Experience. This doc references version 16.2.1 views. Document includes Accessing & Selecting Timesheets, Populate Timesheet, Updating Timesheet, Submitting Timesheet and Entering Time for Someone Else.
