-
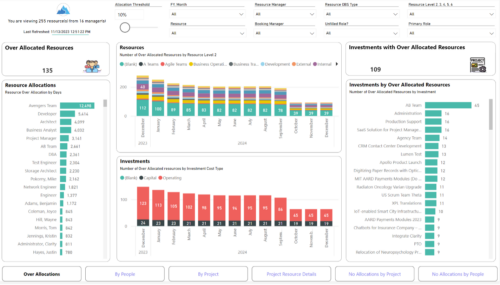
 Evaluate resource allocations, identify bottlenecks, and ensure optimal resource utilization across projects and teams. Report Views include: • Over Allocation • By Project • By People • Project Resource Details • No Allocations by Project • No Allocations by People The main .rpt file will access data through the Data Warehouse.
 -
 Evaluate resource allocations, identify bottlenecks, and ensure optimal resource utilization across projects and teams. Report Views include: • Over Allocation • By Project • By People • Project Resource Details • No Allocations by Project • No Allocations by People The main file will access data through custom queries created via Rego Odata connector.
 -
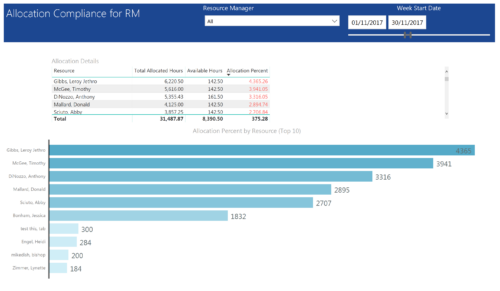 Allocation Compliance by RM report provides resource managers a single place to view Available hours, Allocation Hours and Allocation Percentage of Resources. It considers the resources of selected resource manager and it displays the following: Allocation Details Grid: Displays Resource and its Allocated hours, Available hours and Allocation percentage (Allocated hours/Available Hours) Allocation Percent by Resource: Bar chart that displays Allocation Percentage (top 10) for various resources during the selected Time frame. You can further narrow your search by Resource Manager & Month Start Date range.
 -
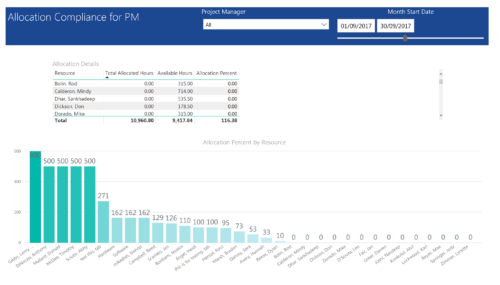 Allocation Compliance by PM report provides project managers a single place to view Available hours, Allocation Hours and Allocation Percentage of Investment Team Resources. It considers the investments of selected project manager and it displays the following: Allocation Details Grid: Displays Resource and its Allocated hours, Available hours and Allocation percentage (Allocated hours/Available Hours) Allocation Percent by Resource: Column chart that displays Allocation Percentage for various resources during the selected Time frame. You can further narrow your search by Project Manager & Month Start Date range.
 -

A presentation slide deck from Rego University 2022. This document reviews the best practices for resource management in Clarity. - Implementation
- Availability
- Allocation
- Assignment
- Reporting
- Notification
- Data Maintenance
-
 Evaluate resource allocations, identify bottlenecks, and ensure optimal resource utilization across projects and teams. Report Views include: • Allocation Discrepancies • Resource Detail • Resource Skills • Resource Summary • Resource Tasks • Staffing Allocations • Staffing ETC Demo Video - https://www.youtube.com/watch?v=0Rzwl1-jbck&list=PLXJ5ktuWV0jiS9CvBpHvBIwpKPmA9uvwK&index=6
 -
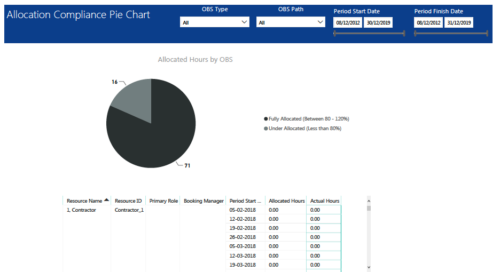 Allocation Compliance Pie Chart report provides resource managers a single place to view Allocation compliance for various resources. It displays the following: Allocated Hours by OBS chart: Pie chart that displays percentage of resources that are fully allocated (80 -120 %) and under allocated (less than 80%) for a particular OBS and selected period range. Grid: Displays Resource Name, Resource Id, Primary Role, Booking Manager, Period, Allocated hours and Actual hours during that period. You can further narrow your search by OBS Type, OBS Path & Period Date range.
 -
 This training document is a Rego Consulting Quick Reference Guide to assist with utilization of the Staffing page in Clarity’s Modern User Experience. This doc references version 16.2.1 views. Document provides detail on the layout and capabilities of the Staff Grid as well as the Allocations Timeline. Information is provided on columns, widgets and filtering. Instructions are provided on how to save Views. Summary information is provided on the layout of the Allocation Timeline and includes detail on the Investment Timeline and the Resource Histogram. Investment Timeline summary contains information on the Allocations by Investments and the Allocations by Resources tabs. While the Resource Histogram section provides screenshots on Resource Availability and Resources by Role.
 -
This training document is a Rego Consulting Quick Reference Guide to assist with Allocations Timeline in Clarity’s Modern User Experience. This doc reviews the Investment Timeline and the Resource Histogram sections of the Allocations Timeline.
-
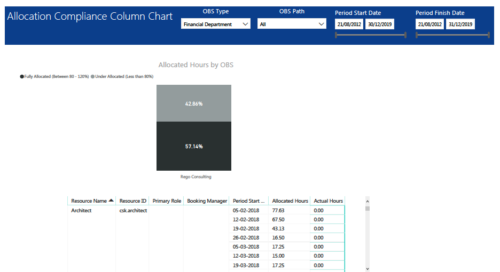 Allocation Compliance Column Chart report provides resource managers a single place to view Allocation compliance for various resources. It displays the following: Allocated Hours by OBS chart: Stacked Column chart that displays percentage of resources that are fully allocated (80 -120 %) and under allocated (less than 80%) for a particular OBS and selected period range. Grid: Displays Resource Name, Resource Id, Primary Role, Booking Manager, Period, Allocated hours and Actual hours during that period. You can further narrow your search by OBS Type, OBS Path & Period Start Date range.
 -
This training document is a Rego Consulting Quick Reference Guide to assist with Allocations Timeline in Clarity’s Modern User Experience. This doc reviews the Investment Timeline and the Resource Histogram sections of the Allocations Timeline.
-
 This training document is a Rego Consulting Quick Reference Guide to assist with Allocations Timeline in Clarity’s Modern User Experience. This doc reviews the Investment Timeline and the Resource Histogram sections of the Allocations Timeline.
 -
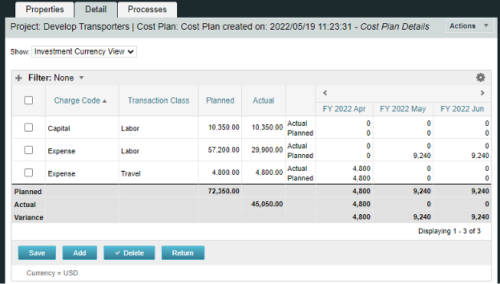
A process creating a new Cost Plan. Cost Plan properties:
Pre-conditions:Name Cost Plan created on: yyyy/mm/dd hh:mm:ss Grouping attributes Charge Code, Transaction Type Start Period The earliest fiscal period with Actuals (from PPA_WIP table) or current period, if there are no actuals Finish Period The latest fiscal period with a non-zero allocation (from PRJ_BLB_SLICES table, SLICE_REQUEST_ID = 6 Period Type Monthly Plan of Record True Planned Cost For periods in the past – from Actuals (Charge Code, Transaction Type, Quantity (Units), Cost (Amount) taken from Transactions (PPA_WIP & PPA_WIP_DETAILS); For current and future periods – from Allocations (Charge Code taken from the Project, Transaction Class from the Resource, Quantity from allocation slices, Cost from the Rate Matrix (NBI_PROJ_RES_RATES_AND_COSTS table) - the Project must be financially enabled.
- if a new Team Member is added, Rate Matrix job must be run, so the rates are populated in the NBI table.
- if the Allocation changes, allow the timeslice job to finish before running the process.
- the Project should have the Charge Code set.
-
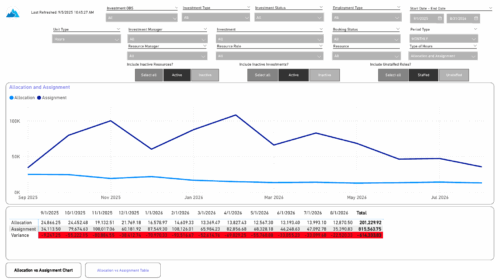 The Investment Allocations and Assignments report provides visibility into team member allocation, task assignment, and variance amounts by investment across time periods. A chart highlights allocation compared to assignment amounts by period. Results can be displayed by week, month, or in total, and viewed in either hours or FTEs for each team member and investment. Interactive visuals make it easy to compare planned effort against actual assignments at the team member and investment level. Content Type: Business Intelligence, PowerBI Report
 -
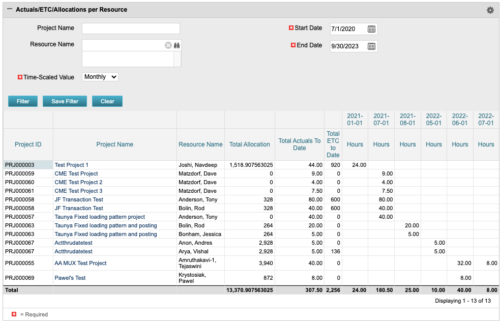 The portlet displays posted time by project for the logged in user based on time period and date range. This allows the user to see at a glance their ETC and actuals on the projects. The portlet displays the Total Allocation and Total Actuals to Date for the user on the projects they are allocated/assigned to. The actuals are displayed per month in the form of TSVs.
 -
The portlet displays posted time by project for the logged in user based on time period and date range. This allows the user to see at a glance their ETC and actuals on the projects. The portlet displays the Total Allocation and Total Actuals to Date for the user on the projects they are allocated/assigned to. The actuals are displayed per month in the form of TSVs.
-

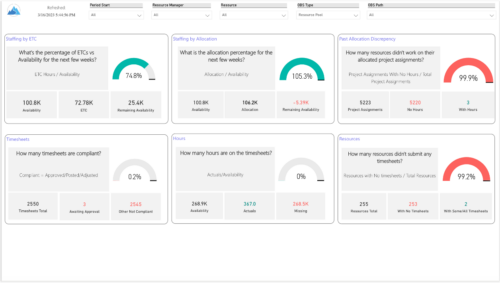
 The Capacity Graph portlet displays Availability, Allocations, Actuals and Assignments for one or more active resource(s) in a single view. This portlet pulls data from timeslices, and allows the user to filter on a weekly, monthly or quarterly data. The Estimated Time to Complete (ETC) and Allocation data will only show for projects that are active. This portlet provides Resource Managers, PMOs and Executives with a simple way to analyse: Allocations vs. Availability, Allocations vs. Actuals, Allocations vs. ETC and ETC vs. Availability. The graph allows the user to determine where areas of improvement may exist and quickly identify potential areas of constraint. Note: the information displayed is dependent on what the user has security rights to view.
 -
The Capacity Graph portlet displays Availability, Allocations, Actuals and Assignments for one or more active resource(s) in a single view. This portlet pulls data from timeslices, and allows the user to filter on a weekly, monthly or quarterly data. The Estimated Time to Complete (ETC) and Allocation data will only show for projects that are active. This portlet provides Resource Managers, PMOs and Executives with a simple way to analyse: Allocations vs. Availability, Allocations vs. Actuals, Allocations vs. ETC and ETC vs. Availability. The graph allows the user to determine where areas of improvement may exist and quickly identify potential areas of constraint. Note: the information displayed is dependent on what the user has security rights to view.
-
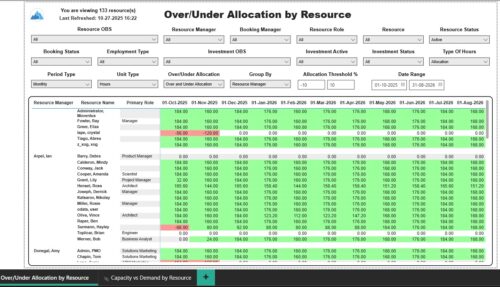 The Over/Under Allocation by Resource report displays resource remaining capacity amounts by resource. The report displays amounts by week or month. The amounts can be displayed as hours or FTEs. This report allows you to drill down to the Capacity vs. Demand by Resource report, by clicking a resource name, to see more information about the resource capacity and demand. Report Prerequisites Verify that you have completed the following prerequisites before you run this report: • The Load Data Warehouse job must be run before you run this report. If the Data Warehouse is not populated, the report will not display any data. Also, most of the report parameters do not display options.
 -
 Do you want to understand the OOTB configuration and functionality of resource management? In this class, we will review the OOTB objects, views, and functions of assignments, allocations, and other related areas. We will cover both classic and new UX highlighting differences.
 -
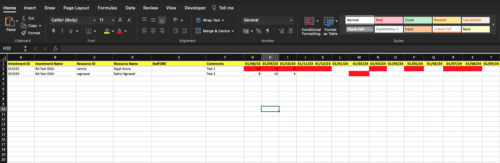
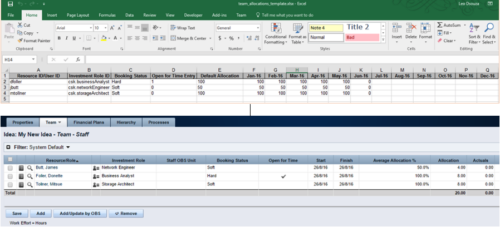 The idea allocation uploader allows you to import in allocations from an external Excel spreadsheet. Populate an Excel template with required fields then import them directly from the Clarity UI. Once imported you’ll see the allocations right on the Team tab of the Idea.
 -
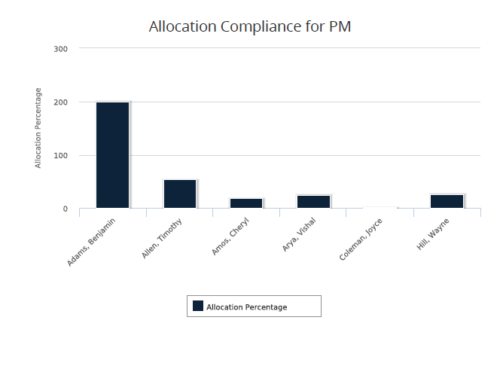 Allocation Compliance for PM report gives a view of resource Allocation percentage for active resources on the team of an investment for a selected Investment Manager. It allows the PM to see resources on their project over the coming months and whether they are over or under allocated. Allocation Percentage is calculated as (‘Allocated Hours’ / ‘Available Hours’) * 100. User can further narrow their search Month Start Date and Investment Manager. User can use exact dates or relative dates for Month Start Date filter parameter.
 -
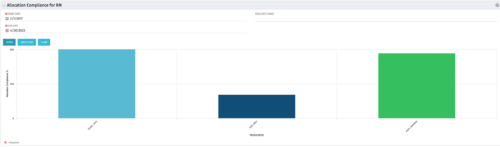 The Allocation Compliance by Resource (Resource Manager) portlet gives a view of resource allocation compliance for all active resources the logged in user is the Resource Manager for. It allows the RM to see resources they manage over the coming months and whether they are over or under allocated. This portlet leverages the daily allocation and daily availability slices as well as only active investments. The portlet provides filters for specific dates, filtering by resource ID, and resource name may also be added.
 -
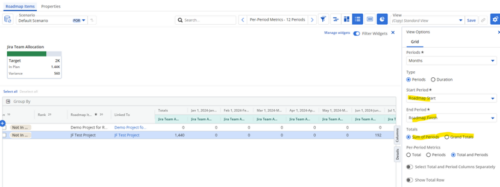
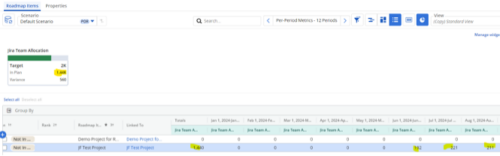 Capture and present allocation data by Team for the Investments included in your Roadmap to enable the ability to compare to Targets or Limits. Allocation data can be presented in Hours or FTE, for Teams Only.


Copyright 2023 • Rego Consulting Corporation • Privacy Policy