-
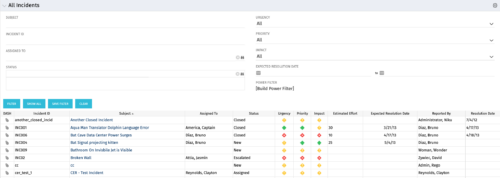 The All Incidents portlet shows all Incidents the user has view rights on and provides a single view to increase ease of management. Status indicators provide a quick overview of incident statuses so a user may prioritize. The filter then allows the user to narrow their search using date ranges and/or resources assigned. Other alternatives for filtering include the status, urgency, priority or impact of the Incident.
 -
The All Incidents portlet shows all Incidents the user has view rights on and provides a single view to increase ease of management. Status indicators provide a quick overview of incident statuses so a user may prioritize. The filter then allows the user to narrow their search using date ranges and/or resources assigned. Other alternatives for filtering include the status, urgency, priority or impact of the Incident.
-
 The All Risks portlet displays all risks related to active projects that the logged in user has view rights to access. The portlet provides the project manager a single place to view risks across multiple projects without having to go into each project individually, and allows for more efficient management and reporting across projects. The portlet displays Project ID, Project, Risk ID, Risk, Category, Assigned to, Status, Probability, Impact, Priority, Target Resolution Date, and Days opened. The filter allows narrowing down of the risks by several different criteria. Note: Only the projects that the user has viewer rights to see will show up in the list.
 -
The All Risks portlet displays all risks related to active projects that the logged in user has view rights to access. The portlet provides the project manager a single place to view risks across multiple projects without having to go into each project individually, and allows for more efficient management and reporting across projects. The portlet displays Project ID, Project, Risk ID, Risk, Category, Assigned to, Status, Probability, Impact, Priority, Target Resolution Date, and Days opened. The filter allows narrowing down of the risks by several different criteria. Note: Only the projects that the user has viewer rights to see will show up in the list.
-
 The All Status Reports portlet displays any published Status Report related to a project or across multiple projects. The filter then allows the user to narrow their search by Project Manager, Project, Status or Overall Status Category (overall, cost & effort, scope or schedule). The user may also select if they wish to view only current Status Reports, or to include historical reports as well. The portlet provides the project manager a single place to view all of the status reports without having to go into each project individually, and allows for more efficient management and reporting across projects. Note: Only the projects that the user has view rights to will show up in the list.
 -
The All Status Reports portlet displays any published Status Report related to a project or across multiple projects. The filter then allows the user to narrow their search by Project Manager, Project, Status or Overall Status Category (overall, cost & effort, scope or schedule). The user may also select if they wish to view only current Status Reports, or to include historical reports as well. The portlet provides the project manager a single place to view all of the status reports without having to go into each project individually, and allows for more efficient management and reporting across projects. Note: Only the projects that the user has view rights to will show up in the list.
-
 The Capacity Graph portlet displays Availability, Allocations, Actuals and Assignments for a Clarity user in a single view. This portlet pulls data from timeslices, and allows the user to filter on a weekly, monthly or quarterly data. The Estimated Time to Complete (ETC) and Allocation data will only show for projects that are active. This portlet provides a Clarity user with a simple way to analyse their: Allocations vs. Availability, Allocations vs. Actuals, Allocations vs. ETC and ETC vs. Availability. The graph allows the user to determine where areas of improvement may exist and quickly identify potential areas of constraint.
 -
The Capacity Graph portlet displays Availability, Allocations, Actuals and Assignments for a Clarity user in a single view. This portlet pulls data from timeslices, and allows the user to filter on a weekly, monthly or quarterly data. The Estimated Time to Complete (ETC) and Allocation data will only show for projects that are active. This portlet provides a Clarity user with a simple way to analyse their: Allocations vs. Availability, Allocations vs. Actuals, Allocations vs. ETC and ETC vs. Availability. The graph allows the user to determine where areas of improvement may exist and quickly identify potential areas of constraint.
-
 The Executive Dashboard portlet displays information regarding projects the user has security rights to view. It provides a one-stop place for the PMO or management to view all critical information about projects. The portlet not only displays status indicators as well as dates for late items, variances and days late, but also displays the project status fields from the Status Report sub-object.
 -
The Executive Dashboard portlet displays information regarding projects the user has security rights to view. It provides a one-stop place for the PMO or management to view all critical information about projects. The portlet not only displays status indicators as well as dates for late items, variances and days late, but also displays the project status fields from the Status Report sub-object.
-
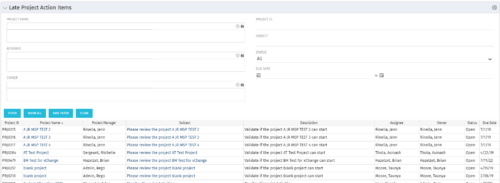 The Late Project Action Items portlet displays all action items related to active projects that the logged in user has view rights to. The action items displayed are those that are past their due date with a status of “In Progress” or “Open”. The portlet provides a Project Manager the ability to view and track action items across multiple projects without going into each project individually. In a single consolidated list, all late project action items can be easily viewed, along with the project with which they are associated, the individual assigned, and the owner of the action item.
 -
The Late Project Action Items portlet displays all action items related to active projects that the logged in user has view rights to. The action items displayed are those that are past their due date with a status of “In Progress” or “Open”. The portlet provides a Project Manager the ability to view and track action items across multiple projects without going into each project individually. In a single consolidated list, all late project action items can be easily viewed, along with the project with which they are associated, the individual assigned, and the owner of the action item.
-
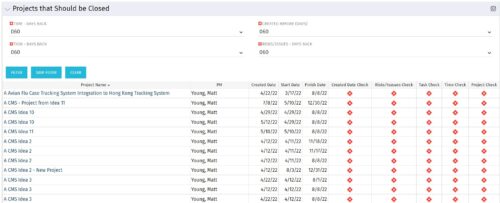
The Projects That Should Be Closed portlet displays all projects that have been created before the specified filter date and has had no new time, tasks, or risks/issues updated after the dates specified in the filter. This can assist in identifying projects that are completed or cancelled and should be closed. The table below describes the available columns in the portlet. Column Label Description Project Name Name of the project PM Manager of the project Created Date Created Date of the project Start Start Date of the project Finish Finish Date of the project Created Date Check Identifies if the project meets the Created Before (Days) filter Risks/Issues Check Identifies if the project meets the Risk/Issues – Days Back filter Task Check Identifies if the project meets the Task – Days Back filter Time Check Identifies if the project meets the Time – Days Back filter Project Check Identifies if the project meets the portlet filter Criteria id Internal code used by the query -
The Projects That Should Be Closed portlet displays all projects that have been created before the specified filter date and has had no new time, tasks, or risks/issues updated after the dates specified in the filter. This can assist in identifying projects that are completed or cancelled and should be closed. The table below describes the available columns in the portlet. Column Label Description Project Name Name of the project PM Manager of the project Created Date Created Date of the project Start Start Date of the project Finish Finish Date of the project Created Date Check Identifies if the project meets the Created Before (Days) filter Risks/Issues Check Identifies if the project meets the Risk/Issues – Days Back filter Task Check Identifies if the project meets the Task – Days Back filter Time Check Identifies if the project meets the Time – Days Back filter Project Check Identifies if the project meets the portlet filter Criteria id Internal code used by the query -
The Projects That Should Be Closed portlet displays all projects that have been created before the specified filter date and has had no new time, tasks, or risks/issues updated after the dates specified in the filter. This can assist in identifying projects that are completed or cancelled and should be closed. The table below describes the available columns in the portlet. Column Label Description Project Name Name of the project PM Manager of the project Created Date Created Date of the project Start Start Date of the project Finish Finish Date of the project Created Date Check Identifies if the project meets the Created Before (Days) filter Risks/Issues Check Identifies if the project meets the Risk/Issues – Days Back filter Task Check Identifies if the project meets the Task – Days Back filter Time Check Identifies if the project meets the Time – Days Back filter Project Check Identifies if the project meets the portlet filter Criteria id Internal code used by the query -
 The Dashboard: Project Status Single-line portlet gives an overview of the project overall status as well as the status indicators on the "current" status report object. The portlet will pull the "id" from the page it is placed on, so this portlet is usually placed on the project dashboard tab. This portlet displays the report date, symbols relating to the overall status, scope, schedule, cost/effort, and the overall explanation across a single line in the portlet.
 -
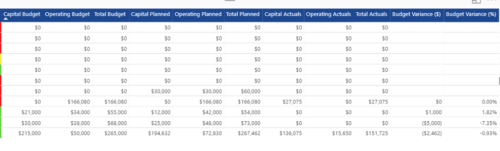
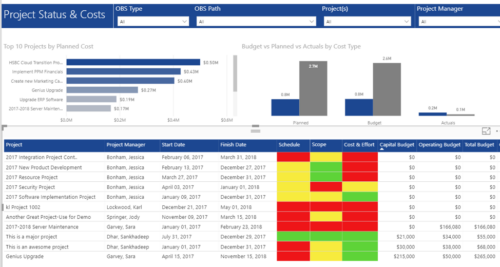 Project Status and Costs report has the details of the Project Schedule, Scope, Cost and Effort Statuses along with Planned, Budget & Actuals costs. There is also graphical representation that shows Top 10 projects by Planned Cost, Budget vs Planned vs Actuals by Cost Type. User can further narrow their search by OBS Type & Path, Project(s) and Project Manager.
 -
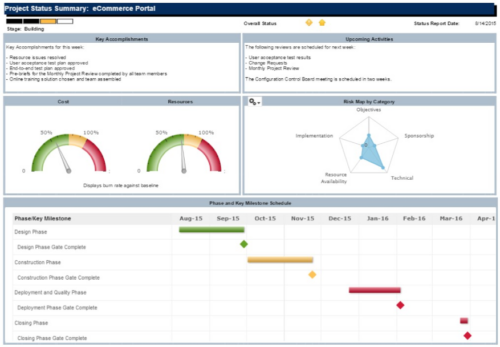 The Project Status Summary report is a transaction based Jaspersoft report that does not require the Load Jaspersoft Datawarehouse job to be run. The report will pull real-time data from the transaction tables in Clarity. This report can be run from either the Advanced Reporting or Reports and Jobs area within Clarity. The Project Status Summary report displays summary information about a project, including current stage, overall status, key accomplishments, upcoming activities, the cost and amount of resources that are consumed, mapped risks indicating categories with a high number of risks, and a high-level Gantt chart displaying information about the project phases and key milestones.


Copyright 2023 • Rego Consulting Corporation • Privacy Policy