-
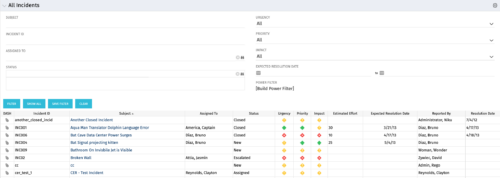 The All Incidents portlet shows all Incidents the user has view rights on and provides a single view to increase ease of management. Status indicators provide a quick overview of incident statuses so a user may prioritize. The filter then allows the user to narrow their search using date ranges and/or resources assigned. Other alternatives for filtering include the status, urgency, priority or impact of the Incident.
 -
The All Incidents portlet shows all Incidents the user has view rights on and provides a single view to increase ease of management. Status indicators provide a quick overview of incident statuses so a user may prioritize. The filter then allows the user to narrow their search using date ranges and/or resources assigned. Other alternatives for filtering include the status, urgency, priority or impact of the Incident.
-
 The All Risks portlet displays all risks related to active projects that the logged in user has view rights to access. The portlet provides the project manager a single place to view risks across multiple projects without having to go into each project individually, and allows for more efficient management and reporting across projects. The portlet displays Project ID, Project, Risk ID, Risk, Category, Assigned to, Status, Probability, Impact, Priority, Target Resolution Date, and Days opened. The filter allows narrowing down of the risks by several different criteria. Note: Only the projects that the user has viewer rights to see will show up in the list.
 -
The All Risks portlet displays all risks related to active projects that the logged in user has view rights to access. The portlet provides the project manager a single place to view risks across multiple projects without having to go into each project individually, and allows for more efficient management and reporting across projects. The portlet displays Project ID, Project, Risk ID, Risk, Category, Assigned to, Status, Probability, Impact, Priority, Target Resolution Date, and Days opened. The filter allows narrowing down of the risks by several different criteria. Note: Only the projects that the user has viewer rights to see will show up in the list.
-
 The All Status Reports portlet displays any published Status Report related to a project or across multiple projects. The filter then allows the user to narrow their search by Project Manager, Project, Status or Overall Status Category (overall, cost & effort, scope or schedule). The user may also select if they wish to view only current Status Reports, or to include historical reports as well. The portlet provides the project manager a single place to view all of the status reports without having to go into each project individually, and allows for more efficient management and reporting across projects. Note: Only the projects that the user has view rights to will show up in the list.
 -
The All Status Reports portlet displays any published Status Report related to a project or across multiple projects. The filter then allows the user to narrow their search by Project Manager, Project, Status or Overall Status Category (overall, cost & effort, scope or schedule). The user may also select if they wish to view only current Status Reports, or to include historical reports as well. The portlet provides the project manager a single place to view all of the status reports without having to go into each project individually, and allows for more efficient management and reporting across projects. Note: Only the projects that the user has view rights to will show up in the list.
-
 The Capacity Graph portlet displays Availability, Allocations, Actuals and Assignments for a Clarity user in a single view. This portlet pulls data from timeslices, and allows the user to filter on a weekly, monthly or quarterly data. The Estimated Time to Complete (ETC) and Allocation data will only show for projects that are active. This portlet provides a Clarity user with a simple way to analyse their: Allocations vs. Availability, Allocations vs. Actuals, Allocations vs. ETC and ETC vs. Availability. The graph allows the user to determine where areas of improvement may exist and quickly identify potential areas of constraint.
 -
The Capacity Graph portlet displays Availability, Allocations, Actuals and Assignments for a Clarity user in a single view. This portlet pulls data from timeslices, and allows the user to filter on a weekly, monthly or quarterly data. The Estimated Time to Complete (ETC) and Allocation data will only show for projects that are active. This portlet provides a Clarity user with a simple way to analyse their: Allocations vs. Availability, Allocations vs. Actuals, Allocations vs. ETC and ETC vs. Availability. The graph allows the user to determine where areas of improvement may exist and quickly identify potential areas of constraint.
-
The Capacity Graph portlet displays Availability, Allocations, Actuals and Assignments for a Clarity user in a single view. This portlet pulls data from timeslices, and allows the user to filter on a weekly, monthly or quarterly data. The Estimated Time to Complete (ETC) and Allocation data will only show for projects that are active. This portlet provides a Clarity user with a simple way to analyse their: Allocations vs. Availability, Allocations vs. Actuals, Allocations vs. ETC and ETC vs. Availability. The graph allows the user to determine where areas of improvement may exist and quickly identify potential areas of constraint.


Copyright 2023 • Rego Consulting Corporation • Privacy Policy